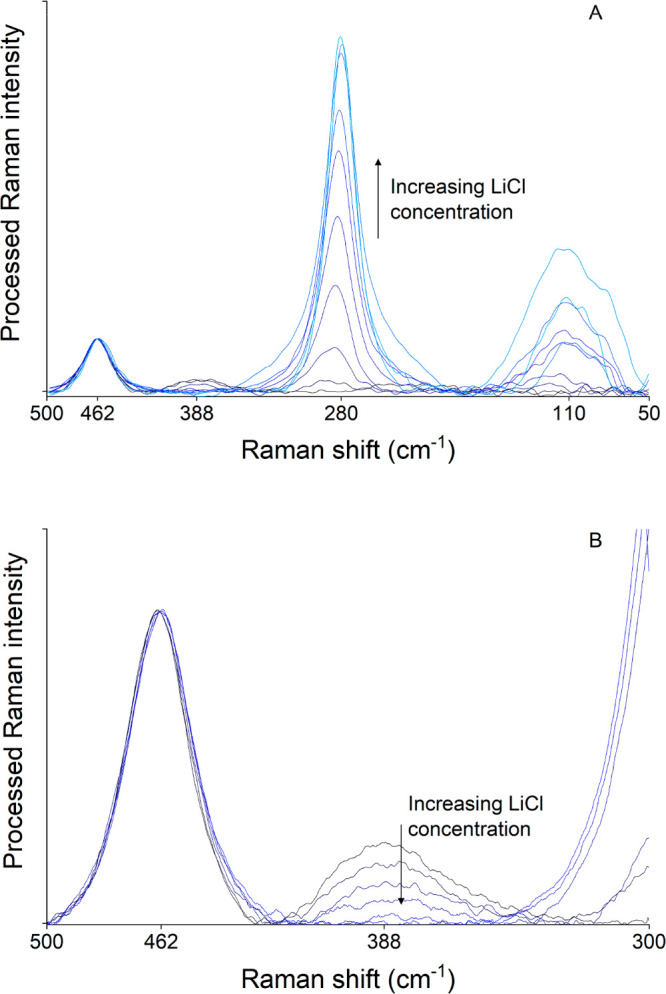
Figure 2.

Raman spectra of 0.05 mol L–1 ZnClO4 in different aqueous LiCl solutions with 0.02 mol L–1 HCl. The LiCl concentration increases from 0 (black spectrum) to 10 mol L–1 (lightest blue spectrum). (A) All Raman features of the Zn(II) complexes and (B) the Raman peak of [Zn(H2O)6]2+ recorded with more sensitive experimental parameters.
