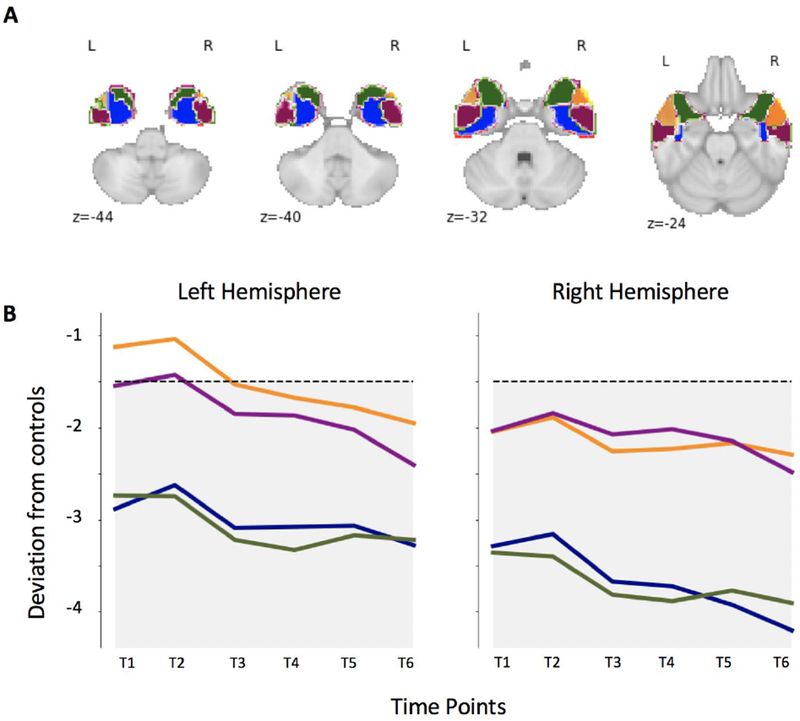
Figure 2. Atrophy distribution and progression.

A) Ad-hoc ROIs parcellating the ATL in portions known to be preferentially connected to specific cortical areas, respectively: the anterior dorsolateral ROI (yellow) to superior occipital pole and superior temporal gyrus; the posterior dorsolateral ROI (purple) to medial temporal gyrus; the anterior ventromedial ROI (green) to orbitofrontal cortex; the posterior ventromedial ROI to (blue) to inferior occipital pole and inferior temporal gyrus.
B) At time 1, the atrophy affects the right more than the left hemisphere, and the medial more than lateral regions within each ATL. The dotted line indicates the threshold below which scores are considered clinically abnormal. The only region above such threshold of significant impairment is the left anterior dorsolateral region at time point 1 and 2. As the disease progresses, a decline is observed across all ROIs in both hemispheres.
