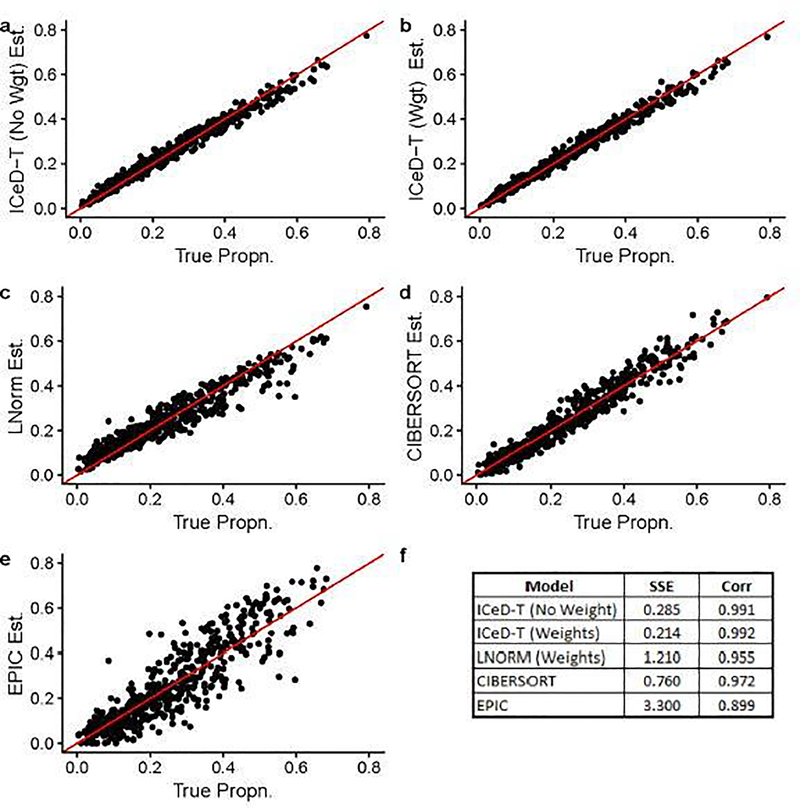
Fig. 2.
Visualized results of model fits on simulated data when ~ 20% of the genes are aberrant. Each dot is an estimate of ρik (the proportion of cells attributable to cell type k, for sample i), where i = 1,…,135 and k = 1,…,4.Figure (f) summarizes the accuracy across all 135 samples for each model.

