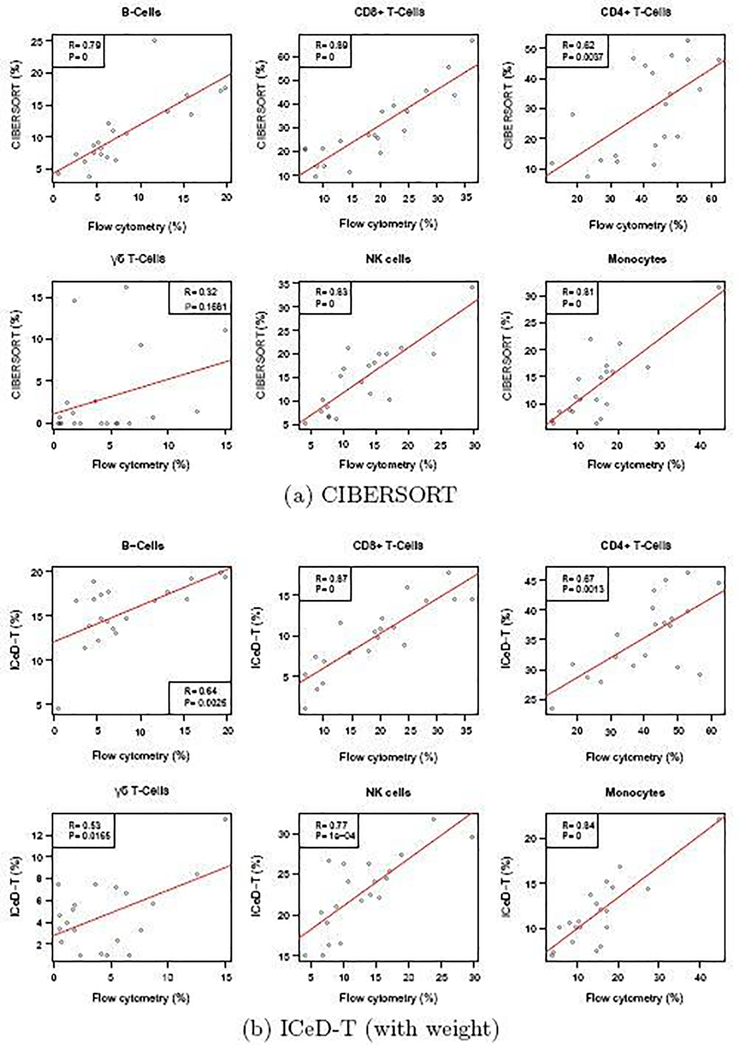
Fig. 4.
Comparison of cell type proportion estimates by CIBERSORT and ICeD-T versus the cell type proportions measured by flow cytometry. Each dot is an estimate of the relative proportion of the specified cell type in one of the 20 samples. Red lines indicate the least squares model fit to the estimated immune proportions.

