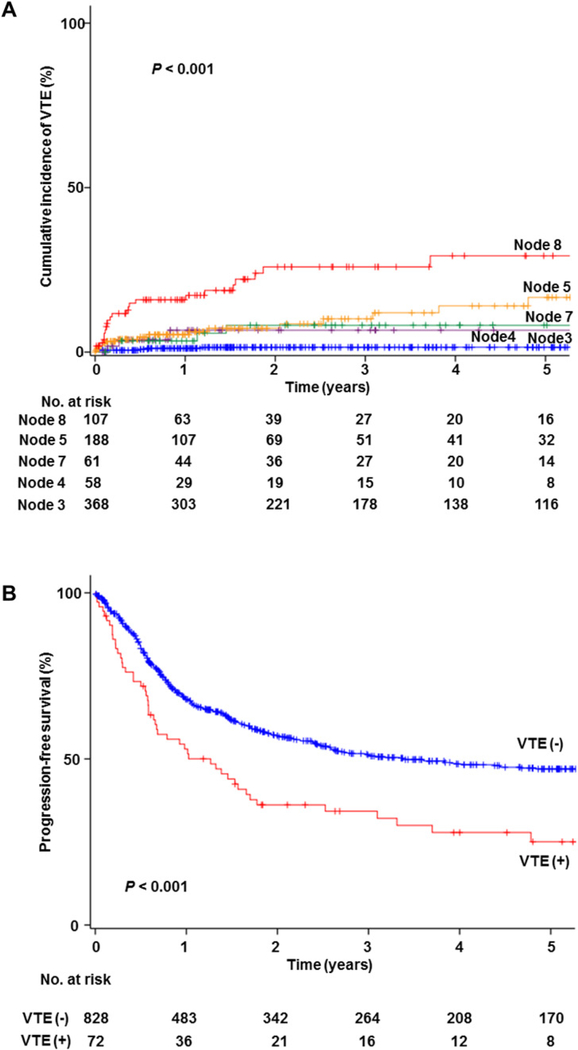
Fig. 2.
Kaplan-Meier curves for venous thromboembolism. Log-rank test for P-values. Follow-up time was truncated at 5 years from surgical treatment. A) Cumulative incidence of VTE based on the risk factor patterns in decision-tree model, and B) progression-free survival based on VTE. Abbreviation: VTE, venous thromboembolism.

