
Figure 4.
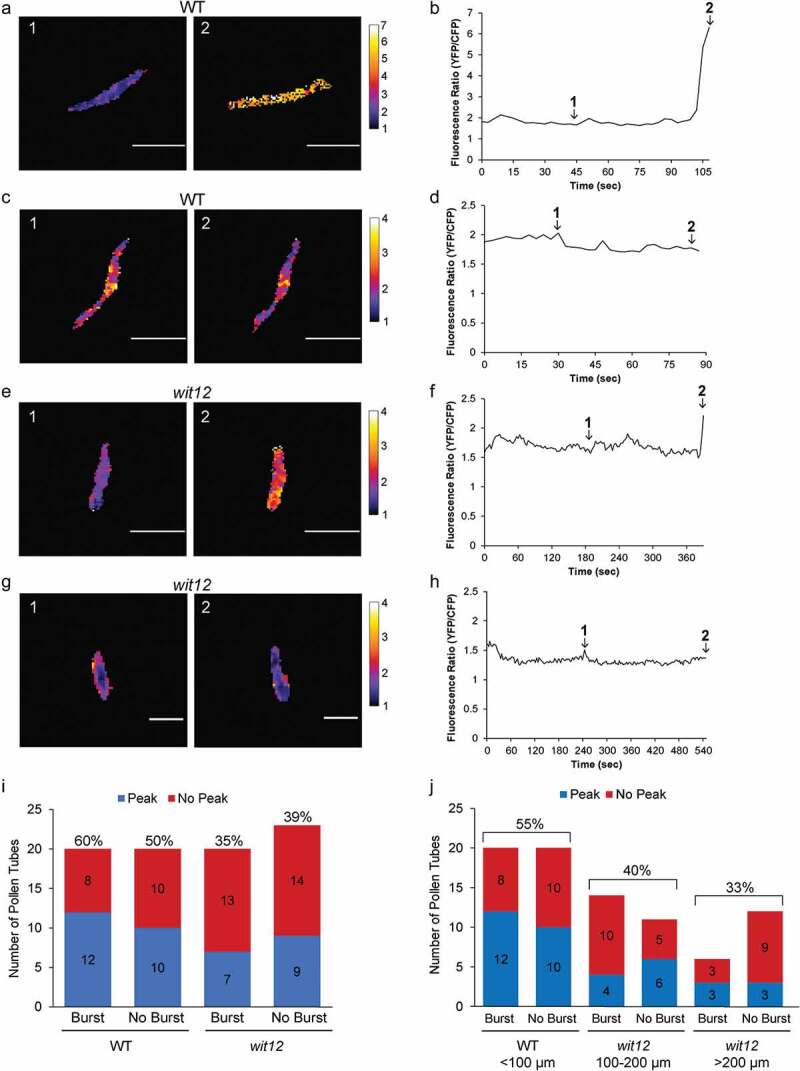
Post-ROS Ca2+ fluctuations.
(a–j), The nucleus-localized Ca2+ sensor (Lat52pro::NLS-YC3.6) was used to measure Ca2+ fluctuations in the VNs after addition of exogenous H2O2. (a–h), Example ratiometric images of nuclear Ca2+ fluctuations prior to pollen tube rupture and corresponding graphs. Scale bar = 10 µm. (a,b), A WT pollen tube with a nuclear Ca2+ peak at 6.5 A.U. prior to rupture. (c,d), A WT pollen tube without a nuclear Ca2+ peak prior to rupture. (e,f), A wit12 pollen tube with a nuclear Ca2+ peak at 2.5 A.U. prior to rupture. (g,h), A wit12 pollen tube without a nuclear Ca2+ peak prior to rupture. Images designated as 1 and 2 in (a,c,e,g) are indicated as time points 1 and 2 in graphs (b,d,f) and (h–j), quantification of presence or absence of peaks for pollen tubes that burst and pollen tubes that fail to burst for both WT and wit12. The numbers of pollen tubes with or without a peak for each condition is shown in the bar graph. (i), WT is compared to the entire wit12 population. The percent of pollen tubes that presented a nuclear Ca2+ peak is shown above each bar. (j), wit12 columns were split based on the distance of the VN from the pollen tube tip. The percent of pollen tubes that presented a nuclear Ca2+ peak, with burst and no burst combined for each group, is shown above each bar.