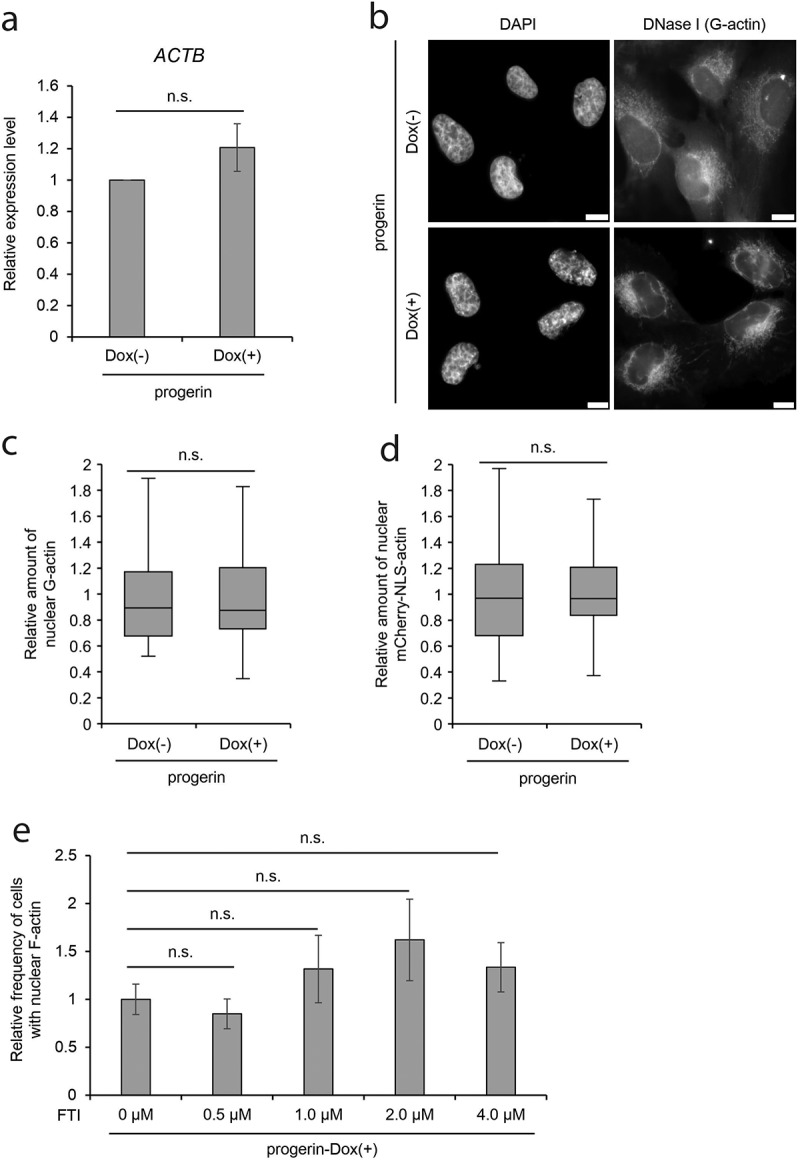
Figure 2.

Indices of nuclear actin in progerin-expressing cells. (a) The relative expression level of ACTB gene in progerin-expressing cells. The expression level was measured by qRT-PCR and was normalized with respect to that of GAPDH gene. The expression level of ACTB in progerin-Dox(-) cells was assigned as 1.0. Data shown are mean ± SEM of three independent experiments. (b) Images of progerin-expressing cells stained by DAPI and DNase I conjugated with Alexa Fluor 594 (DNase I). Scale bar, 10 μm. (c) The relative amount of nuclear G-actin was defined as the ratio of nuclear to the cytoplasmic signal intensity of DNase I-staining of progerin-expressing cells. Data are shown as a box plot. The mean value of progerin-Dox(-) cells was assigned as 1.0. Error bars indicate standard deviation (SD) of three independent experiments. For quantification, 88 cells (progerin-Dox(-)) and 87 cells (progerin-Dox(+)) were analyzed. More than 20 cells were analyzed in each independent experiment. (d) The relative amount of nuclear mCherry-NLS-actin was defined as the ratio of nuclear to the cytoplasmic signal intensity of mCherry-fluorescence in progerin-expressing cells and shown as in C. Error bars indicate SD of three independent experiments. For quantification, 63 cells and 83 cells were analyzed. More than 20 cells were analyzed in each independent experiment. (e) Relative frequency of nuclei possessing nuclear F-actin in progerin-expressing cells treated with FTI. The mean value of progerin-expressing cells without FTI treatment was defined as 1.0. Data shown are mean ± SEM of three (4.0 μM FTI) and four (0, 0.5, 1.0, and 2.0 μM FTI) independent experiments. For quantification, 459 cells (0 μM FTI), 429 cells (0.5 μM FTI), 533 cells (1.0 μM FTI), 506 cells (2.0 μM FTI), and 335 cells (4.0 μM FTI) were analyzed. n.s., not significant.
