. 2020 Aug 26;2(5):e200007. doi: 10.1148/ryai.2020200007

Figure 5:

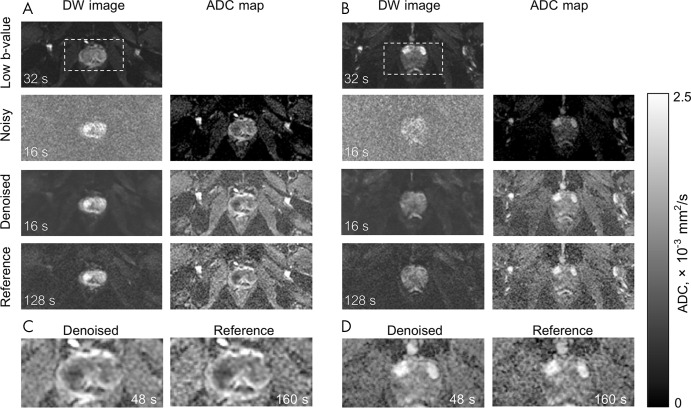
Representative examples of diffusion-weighted (DW) images and derived apparent diffusion coefficient (ADC) maps. A and B show images from two separate patients (not used in Figure 3). DW image column contains low b-value image (four averages), noisy and/or denoised (two averages), and reference (16 averages) high b-value DW images. Low b-value image was used to compute the ADC maps. Noisy ADC maps strongly underestimate ADC values. Denoised ADC maps with an acquisition time of 48 seconds are comparable with the reference ADC maps with an acquisition time of 160 seconds. Zoomed-in view on the boxed regions from A and B are displayed in C and D. Acquisition times are based on a repetition time of 8000 msec, single diffusion direction, and corresponding number of averages.

Representative examples of diffusion-weighted (DW) images and derived apparent diffusion coefficient (ADC) maps. A and B show images from two separate patients (not used in Figure 3). DW image column contains low b-value image (four averages), noisy and/or denoised (two averages), and reference (16 averages) high b-value DW images. Low b-value image was used to compute the ADC maps. Noisy ADC maps strongly underestimate ADC values. Denoised ADC maps with an acquisition time of 48 seconds are comparable with the reference ADC maps with an acquisition time of 160 seconds. Zoomed-in view on the boxed regions from A and B are displayed in C and D. Acquisition times are based on a repetition time of 8000 msec, single diffusion direction, and corresponding number of averages.