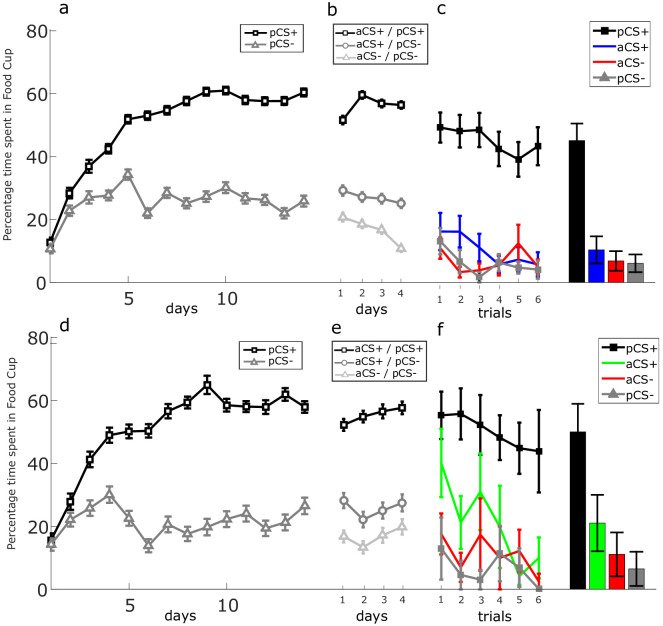
Figure 5. Food cup responses of the partner rat during learning.
Experimental group 1 (combined social-appetitive and social-only subgroups): (a) Percentage of time spent in the food cup during discrimination learning. (b) Percentage of time spent in the food cup during social learning. (c) Percentage of time spent in the food cup during the first six trials of the probe phase. Control group 1a (inserted wall): (d) Percentage of time spent in the food cup during discrimination learning. (e) Percentage of time spent in the food cup during social learning. (f) Percentage of time spent in the food cup during the first six trials of the probe phase. Bar plots indicate averaged time spent in the food cup over six probe trials between aCS+, pCS+ (unblocked), pCS- (blocked), and aCS-. Error bars indicate SEM.

