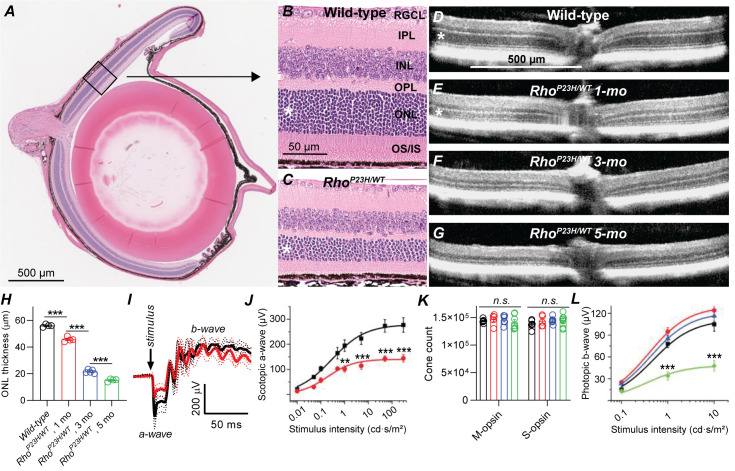
Figure 1. Characterization of retinal degeneration progression in heterozygote P23H rhodopsin-mutated mice.
(A) Representative histology image of a wild-type (WT) mouse eye. (B–C) Representative magnified histology images of 1-month-old WT (B) and P23H (C) dorsal retinas. Asterisks mark the ONL, i.e. photoreceptor nuclei layer. RGCL, retinal ganglion cell layer; IPL, inner plexiform layer; INL, inner nuclear layer; OPL, outer plexiform layer (the site of photoreceptor-bipolar cell synapse); IS/OS, photoreceptor inner and outer segments. (D–G) Representative optical coherence tomography images. (H) ONL thickness analysis from central retina (WT, black, n = 4; P23H one mo, red, n = 4; P23H three mo, n = 5; P23H five mo, green, n = 4 mice). (I) Scotopic ERG waveforms in response to 100 cd•s/m2 flash in 1-month-old WT (black) and P23H (red) mice (WT, black, n = 4 (8); P23H, red, n = 4 (8) mice(eyes)). (J) ERG a-wave amplitude analysis at 1 month of age. (K) Total M- and S-opsin counts in whole mount retinas (WT, black, n = 6; P23H one mo, red, n = 5; three mo, blue, n = 6; five mo, green, n = 7 mice) (L) Photopic ERG b-wave amplitude analysis (WT, black, n = 6 (12); P23H one mo, red, n = 8 (16); three mo, blue, n = 7 (14); five mo, green, n = 5 (10) mice(eyes)). Bonferroni post hoc tests: *p<0.05, **p<0.01, ***p<0.001.


