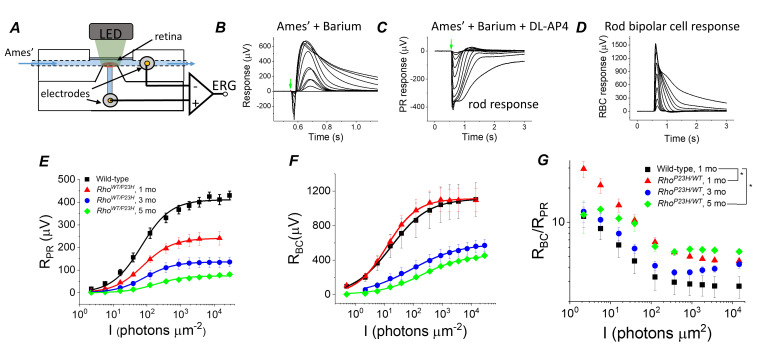
Figure 4. Sensitivity of bipolar cell responses to their photoreceptor input increases in P23H mice.
(A) Custom ex vivo ERG specimen holder used to record transretinal voltage with two Ag/AgCl macro electrodes. Isolated retina without retinal pigment epithelium is mounted photoreceptor side up and perfused with Ames’ medium. (B) Representative light flash responses from a dark-adapted WT control mouse retina perfused with Ames' containing 100 µM BaCl2 to remove signal component arising from Müller cells. (C) Light responses from the same retina after addition of DL-AP4 eliminating metabotropic glutamatergic transmission to reveal the photoreceptor-specific responses. (D) Bipolar cell responses obtained by subtracting the traces shown in (C) from those in (B). Amplitude data for photoreceptor (RPR, E) and bipolar (RBC, F) responses, and RBC/RPR ratio (G) as a function of light flash intensity in photons μm−2 (505 nm). Mean ± SEM. In panel G, *p<0.05 (two-way ANOVA between-subjects effect). Smooth traces in E and F plot Equation 1 fitted to the mean amplitude data. Statistics for Rmax and intensity required to generate half-maximal photoreceptor or ON bipolar cell response (I1/2) are in Table 1. (Control, one mo, n = 4; P23H, one mo, n = 4; three mo, n = 3; five mo, n = 4 mice/retinas).

