. 2020 Sep 22;9:e59422. doi: 10.7554/eLife.59422

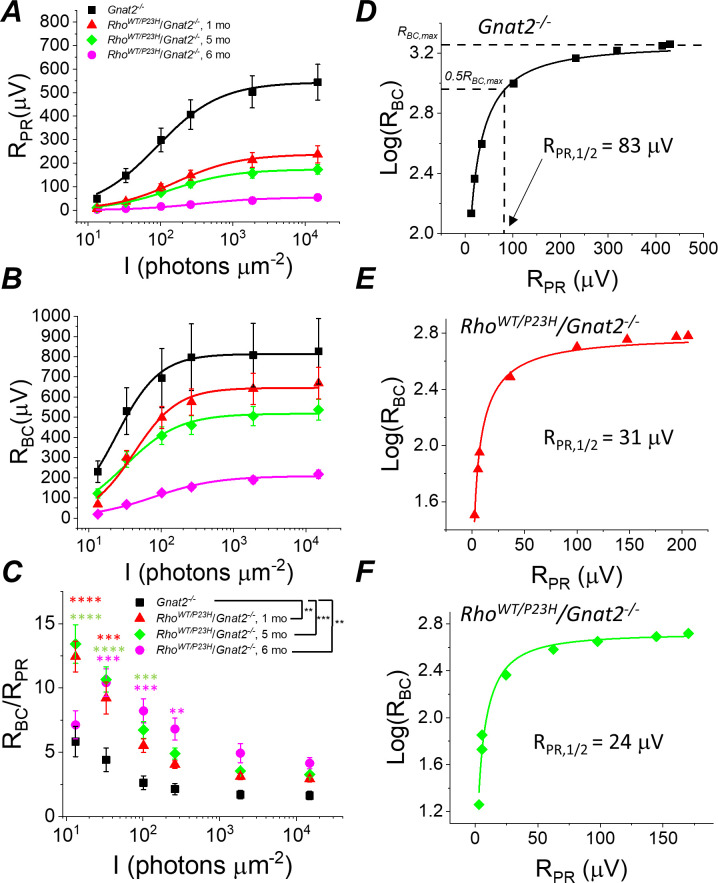
Figure 5. Sensitivity of rod bipolar cell responses to their rod input increases in P23H/Gnat2-/- mice.

Ex vivo ERG rod (A) and RBC (B) response amplitudes, and their ratio (C) derived as in Figure 4. (D–F) RBC plotted as a function of RPR in individual retinas from Gnat2-/- control (D), and one month (E) and five month (F) P23H/Gnat2-/- mice. Smooth lines in A and B plot Equation 1 fitted to mean data. Smooth lines in D-F plot Equation 2 fitted to data from individual retinas. *p<0.05, **p<0.005, ***p<0.001, ****p<0.0001. Statistics for Rmax and intensity required to generate half-maximal rod or RBC response (I1/2) as well as RPR,1/2 are in Table 1. In C, two-way ANOVA followed by Bonferroni’s post hoc test was used to compare between-subjects main effect and the intensity where a significant effect was found, respectively. (Pooled control, 1–6 mo, n = 7 (11); P23H, one mo, n = 4 (6); five mo, n = 11(18); six mo, n = 2 (4) mice(retinas)).

Figure 5—source data 1. Photoreceptor (RPR, A) and bipolar cell (RBC, B) amplitude, and RBC/RPR ratio (C) data for individual mice/retinas.

Figure 5.

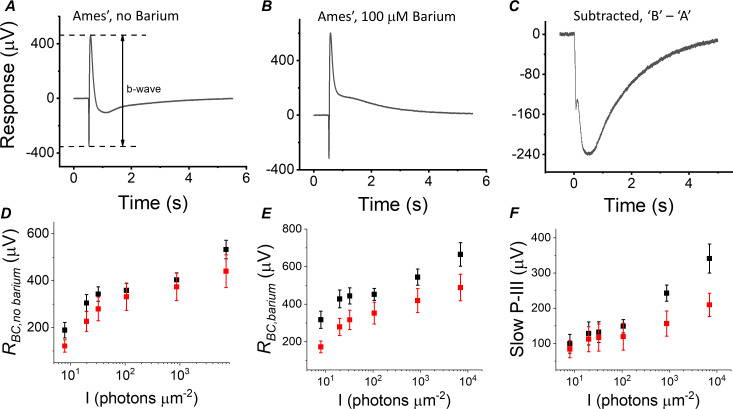
Figure 5—figure supplement 1. Contribution of Müller cell response on the ex vivo ERG light responses in control and P23H mice.

Figure 5—figure supplement 1.

Light responses to identical flash of light in the absence of BaCl2 (A), in the presence of 100 μM BaCl2 (B) and Müller cell response (slow PIII) derived by subtracting the response in B from that shown in A (C). Mean (± SEM) b-wave amplitudes as a function of light flash intensity in the absence (D) and presence (E) of BaCl2 in 1-month-old control Gnat2-/- (black) and P23H/Gnat2-/- (red) mice. (F) Slow P-III amplitudes plotted as a function of light flash intensity in control and P23H mice. (Control, n = 5 (8); P23H, n = 8 (12) mice(retinas)). No differences between control and P23H mouse means in D and E. A statistically significant group-stimulus intensity interaction was found in F (p<0.01); however, post-hoc test did not reach statistical criterion at any light intensity. Statistical analysis was performed by repeated measures two-way ANOVA followed by Bonferroni’s post hoc test.
Figure 5—figure supplement 1—source data 1. Bipolar cell amplitudes in the absence (D) and presence (E) of Barium, and slow-PIII amplitudes (F) for individual mice/retinas.