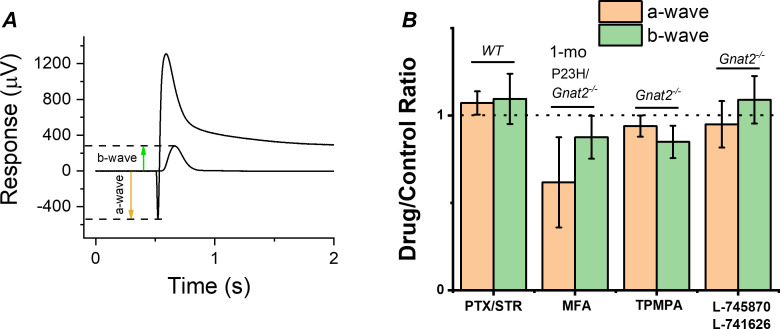
Figure 6. Contribution of gap junctions or inhibitory synaptic inputs to bipolar cells on the photoreceptor and bipolar cell components of the ex vivo ERG signal.
(A) Example traces to dim and bright flashes recorded from a dark-adapted wild-type mouse retina perfused with Ames’ containing 100 µM BaCl2. B-wave amplitudes were measured from baseline using the dim flash responses and a-wave amplitudes from the baseline using the bright flash responses as indicated by arrows. (B) Mean ± SEM a- (brown, a-wavedrug/a-wavecontrol) and b-wave (green, b-wavedrug/b-wavecontrol) ratios determined from the each individual retina perfused with control solution and solution containing 100 µM of the gap junction blocker meclofenamic acid (MFA), 100 µM of picrotoxin (PTX) and 10 µM strytchinine (STR), 10 µM of the dopamine D2 and D4 receptor antagonists L-745870 and L-741626, respectively, or 50 µM the GABAC receptor antagonist (1,2,5,6-Tetrahydropyridin-4-yl)methylphosphinic acid (TPMPA). Mouse genotypes for each drug experiment is indicated in Figure. No statistically significant changes in a- or b-wave amplitudes was observed with any of the drugs tested by paired t-test. n = 6 retinas for PTX/STR, n = 3 retinas for each MFA, TPMPA, and L-745870/L741626 experiments.

