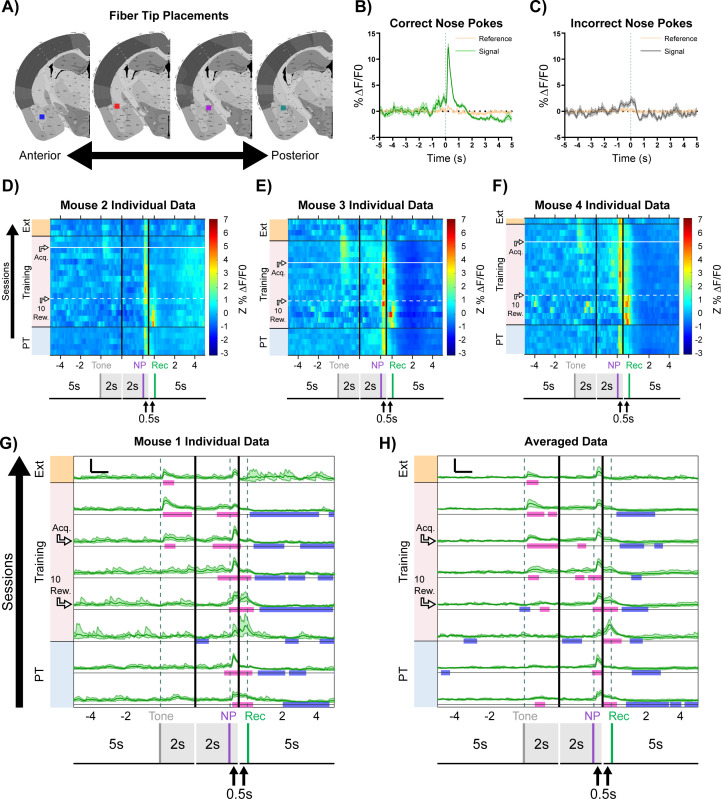
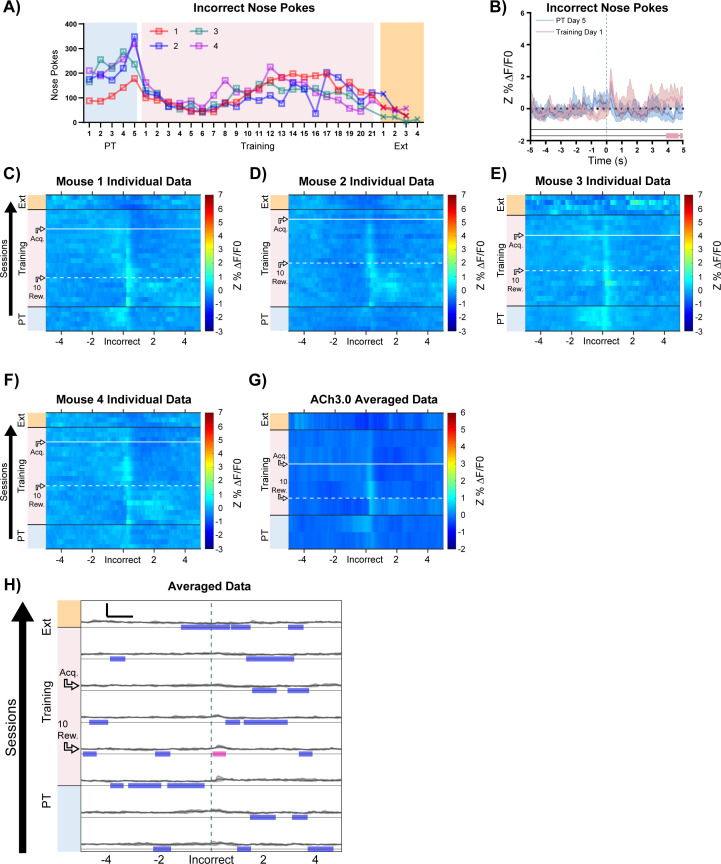
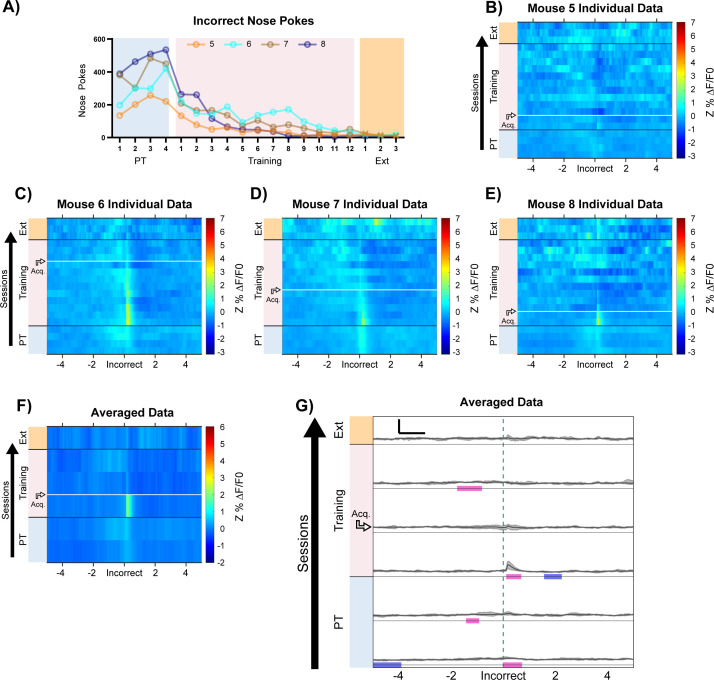
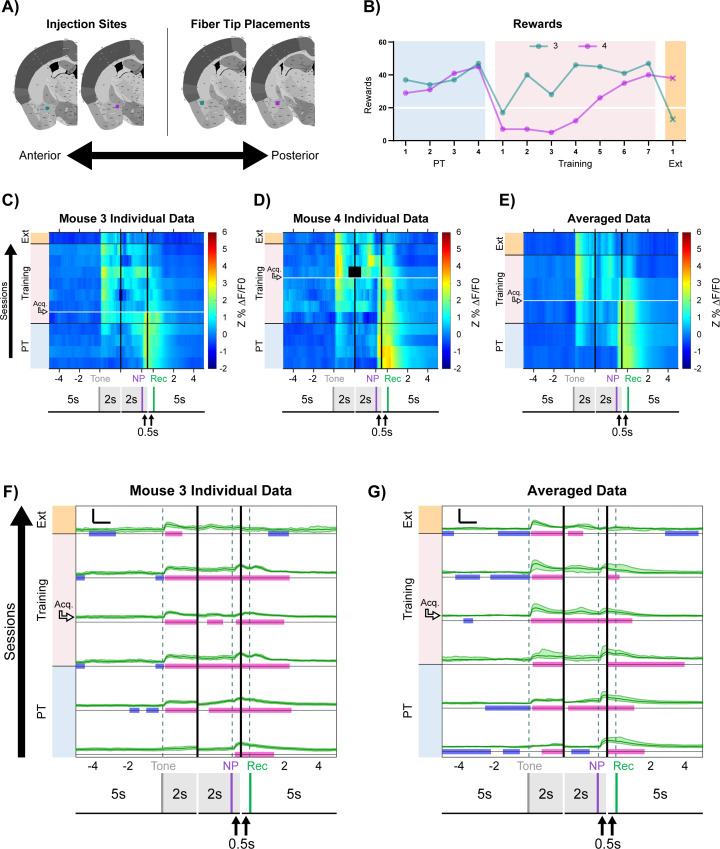
Figure 2. Basolateral amygdala (BLA) ACh signaling aligns with salient events during reward learning.
(A) Diagram and example of injection and fiber placement sites in the BLA for recording from mice expressing a fluorescent acetylcholine sensor (ACh3.0). Left: Diagram of BLA ACh3.0 injection and fiber tip placement. Right: Representative coronal brain slice with fiber tip and ACh3.0 expression. Blue: DAPI, Green: ACh3.0. White dashed line: BLA outline. Gray dashed rectangle: fiber track. Scale = 500 µm. Individual fiber placements are shown in Figure 2—figure supplement 1A. (B) Behavioral responses of mice expressing ACh3.0 in BLA. Individual mice acquired the task at different rates as measured by rewards earned. Horizontal white line: acquisition threshold, when a mouse began to earn 20 rewards consistently in Training. Incorrect nose pokes shown in Figure 2—figure supplement 2A. Pre-Training (PT): blue shaded area, Training: pink shaded area, Extinction (Ext): orange shaded area. (C) Fluorescence traces from BLA of ACh3.0-expressing mouse. A significant increase in fluorescence representing BLA ACh release consistently coincided with correct (green line) but not incorrect (gray line) nose pokes on the last day of PT (data are shown from Mouse 1). The mean Z-scored precent ΔF/F0 (Z%ΔF/F0) overlaid on bootstrapped 99% confidence intervals (99% bCIs). Shaded significance bars under traces represent time points where 99% bCIs do not contain 0 for at least 0.5 s. Correct: n = 24; downsampled incorrect: n = 24 of 58. Traces of signal and reference channels (%ΔF/F0) during nose pokes are shown in Figure 2—figure supplement 1B–C. Incorrect nose pokes on the last day of PT versus Training Day 1 shown in Figure 2—figure supplement 2B. (D) Heatmap of BLA ACh signaling in Mouse 1 across all training phases, aligned to tone onset (Tone), correct nose poke (NP), and receptacle entry (Rec). Each row is the average of rewarded trials across a training session. White dashed horizontal line: first Training day earning 10 rewards. Horizontal white line: acquisition threshold, when a mouse began to earn 20 rewards consistently in Training. Black horizontal lines: divisions between training phases. Black vertical lines: divisions between breaks in time to allow for variable latencies in tone onset, correct nose poke, and receptacle entry (reward retrieval). The bCI plot for Mouse 1 is in Figure 2—figure supplement 1G. Individual heatmaps for mice 2–4 in Figure 2—figure supplement 1D–F. Incorrect nose pokes heatmaps for individual mice shown in Figure 2—figure supplement 2C–F. (E) Heatmap of BLA ACh signaling averaged across mice. Signal aligned as in (D) with a selection of data from key days in the behavioral paradigm shown. From bottom to top: PT Day 1, PT Day 5, Early Training Day, First Training day earning 10 rewards (white dashed horizontal line), Mid Training Day, Acquisition Day (white horizontal line), Last Training Day, Last Extinction Day. The bCI plot for cohort averaged data is in Figure 2—figure supplement 1H. Incorrect nose poke heatmap and bCI plot averaged across mice shown in Figure 2—figure supplement 2G–H. (F) Diagram and example of Nucleus Basalis of Mynert (NBM)-BLA terminal fiber recordings. Left: DIO-GCaMP7s was injected in the NBM of ChAT-IRES-Cre mice, individual injection sites are shown in Figure 2—figure supplement 5A. Representative coronal brain slice showing GCaMP7s expression. White dashed lines: internal capsule and globus pallidus outlines. Blue: DAPI, Green: GCaMP7s, Red: ChAT. Scale = 500 µm; separate channels shown in Figure 2—figure supplement 5B. Right: An optical fiber was implanted above the ipsilateral BLA, individual fiber placements are shown in Figure 2—figure supplement 5A. Representative coronal brain slice showing GCaMP7 expression and fiber tip placement. White dashed line: BLA outline. Gray dashed rectangle: fiber tract. Blue: DAPI, Green: GCaMP7s, Red: ChAT. Scale = 500 µm; separate channels shown in Figure 2—figure supplement 5C. (G) Behavioral responses of mice during NBM-BLA terminal fiber recordings. White horizontal line: acquisition threshold, when a mouse began to earn 20 rewards consistently in Training. Incorrect nose pokes shown in Figure 2—figure supplement 6A. (H) NBM-BLA terminal fiber activity is similar to ACh3.0 recordings. NBM-BLA terminal fiber activity significantly increased with correct (green line) but not incorrect (gray line) nose pokes on the last day of PT (data shown for Mouse 1). Mean Z%ΔF/F0 overlaid on bootstrapped 99% confidence intervals (99% bCIs). Shaded significance bars under traces represent time points where 99% bCIs do not contain 0 for at least 0.5 s. Correct: n = 42; downsampled incorrect: n = 42 of 101. Signal and reference channels (%ΔF/F0) during nose pokes are shown in Figure 2—figure supplement 5D–E. Incorrect nose pokes on the last day of PT versus Training Day 1 shown in Figure 2—figure supplement 6B. See Figure 2—figure supplement 9A–H for simultaneous ACh3.0 and NBM-BLA terminal fiber recordings. (I) Heatmap of NBM-BLA terminal fiber activity in Mouse 1 across all training phases, as in (D-E). Blanks in the heatmaps indicate time bins added for alignment. bCI plot for Mouse 1 in Figure 2—figure supplement 7F. Mouse 2 individual heatmap shown in Figure 2—figure supplement 5F. Incorrect nose pokes heatmaps for individual mice shown in Figure 2—figure supplement 6C–D. (J) Heatmap of NBM-BLA terminal fiber activity averaged across mice. Signal aligned as in (D-E, I) with a selection of key days shown, from bottom to top: PT Day 1, PT Day 4, Early Training, Acquisition Day (white horizontal line), Last Training Day, Last Extinction Day. The bCI plot for cohort averaged data in Figure 2—figure supplement 7G. Incorrect nose poke heatmap and bCI plot averaged across mice shown in Figure 2—figure supplement 6E + Figure 2—figure supplement 8E.


