. 2020 Sep 18;9:e57335. doi: 10.7554/eLife.57335

Figure 3. BLA CaMKIIα neuron activity aligns to reward retrieval and cue-reward learning.

(A) Diagram and example of injection and fiber placement sites in the BLA for recording from CaMKIIα-Cre mice expressing a fluorescent calcium indicator (DIO-GCaMP6s). Left: Diagram of injection and fiber placement. Right: Representative coronal brain slice with fiber tip and GCaMP6s expression. White dashed line: BLA outline. Gray dashed rectangle: fiber tract. Blue: DAPI, Green: GCaMP6s. Scale 500 µm. Individual fiber placements are shown in Figure 3—figure supplement 1A. (B) Fluorescence traces from BLA of GCaMP6s-expressing CaMKIIα-Cre mice. On the last day PT (data shown for mouse 1), correct nose pokes (green line) were followed by a modest but significant rise in BLA CaMKIIα cell activity that increased steeply following receptacle entry (Figure 3—figure supplement 1B) while incorrect nose pokes (gray line) were followed by a modest decrease in activity. Mean Z%ΔF/F0 overlaid on bootstrapped 99% confidence intervals (99% bCIs). Shaded significance bars under traces represent time points where 99% bCIs do not contain 0 for at least 0.5 s. Correct: n = 44; downsampled incorrect: n = 44 of 141. Signal and reference channels (%ΔF/F0) during nose pokes are shown in Figure 3—figure supplement 1C–D. Incorrect nose pokes on the last day of PT versus Training Day 1 shown in Figure 3—figure supplement 2B. (C) Behavioral responses of CaMKIIα-Cre mice expressing GCaMP6s in BLA. Individual mice acquired the task at different rates as measured by rewards earned. Horizontal white line: acquisition threshold, when a mouse began to earn 20 rewards consistently in Training. Incorrect nose pokes shown in Figure 3—figure supplement 2A. (D) Heatmap of BLA CaMKIIα cell activity (Mouse 1) across all training phases, aligned to tone onset (Tone), correct nose poke (NP), and receptacle entry (Rec). Each row is the average of rewarded trials across a training session. White horizontal line: Day acquisition threshold met, as determined by rewards earned. Black horizontal lines: divisions between training phases. Black vertical lines: divisions between breaks in time to allow for variable latencies in tone onset, correct nose poke, and receptacle entry. Blanks in the heatmaps indicate time bins added for alignment. The bCI plot for Mouse 1 in Figure 3—figure supplement 1G. Individual heatmaps for mice 2–3 in Figure 3—figure supplement 1E–F. Incorrect nose pokes heatmaps for individual mice shown in Figure 3—figure supplement 2C–E. (E) Heatmap of BLA CaMKIIα cell activity averaged across mice. Signal aligned as in (D) with a selection of key days shown, from bottom to top: PT Day 1, PT Day 4, Early Training Day, Acquisition Day (white horizontal line), Last Extinction Day. The bCI plot for cohort averaged data in Figure 3—figure supplement 1H. Incorrect nose poke heatmaps averaged across mice shown in Figure 3—figure supplement 2F.

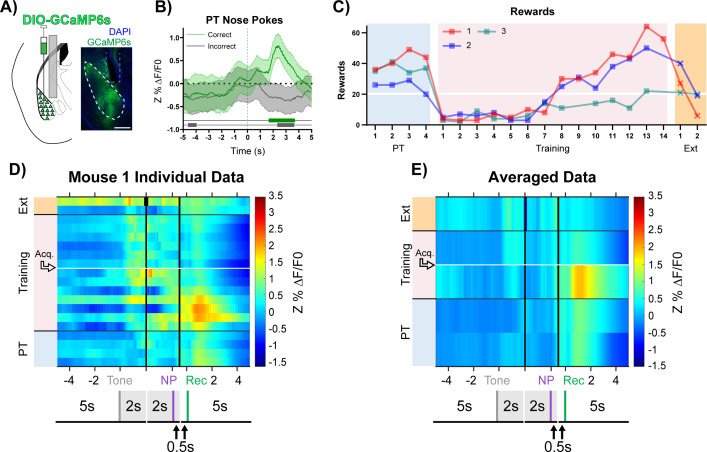
Figure 3.

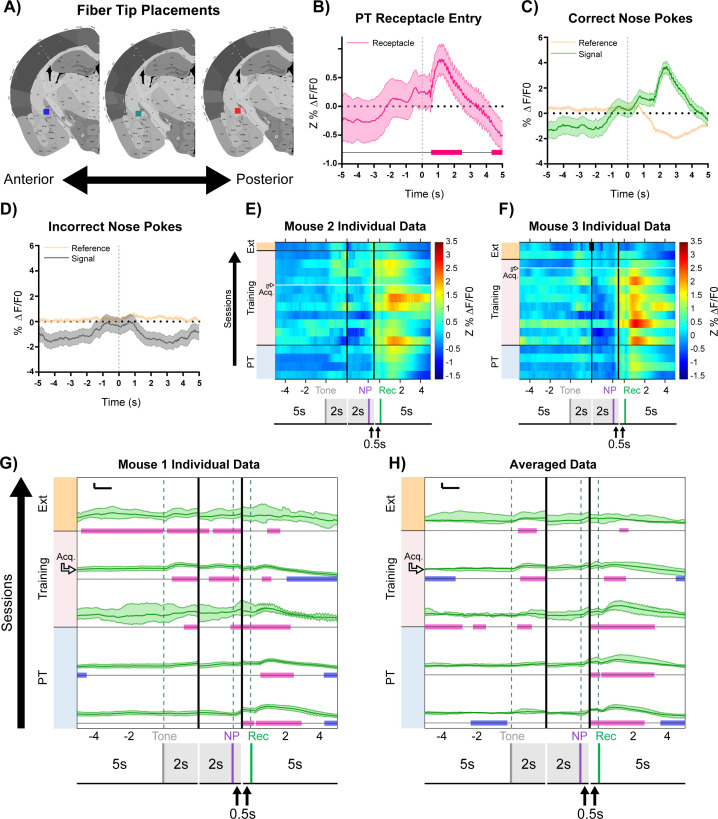
Figure 3—figure supplement 1. GCaMP6s recording in BLA CaMKIIα cells.

Figure 3—figure supplement 1.

(A) Squares indicate optical fiber tips for individual mice. 1 (red), 2 (blue), 3 (teal). (B) Increase in fluorescence (Z%ΔF/F0) during the last day of PT (data shown for Mouse 1) aligns more closely to receptacle entry (reward retrieval) on rewarded trials. Mean ± SEM, n = 44. (C) Increase in fluorescence (%ΔF/F0) following correct nose pokes is specific to the signal (465 nm, green) channel and is not observed in the reference channel (405 nm, tan). Mirroring in reference channel following correct nose poke is likely due to a change in the pool of unbound sensor, because data are not acquired at the ‘true’ isosbestic point of GCaMP (Barnett et al., 2017; Kim et al., 2016a; Sych et al., 2019). Data from Mouse 1, PT Day 4 as in Figure 3B. Mean ± SEM, n = 44. (D) Decrease in fluorescence (%ΔF/F0) following incorrect nose pokes is seen in signal channel (465 nm, gray) but not reference channel (405 nm, tan). Data from Mouse 1, PT Day 4 as in Figure 3B. Downsampled mean ± SEM, n = 44 of 141. (E–F) Individual data for mice not shown in Figure 3D. White horizontal line: acquisition threshold. (G) Mouse 1 combined action bCI plot for subset of days used in cohort averaged heatmap Figure 3E (from bottom to top: PT Day 1, PT Day 4, Early Training Day, Acquisition Day, Last Extinction Day). Mean overlaid on 99% bCIs for tone onset, correct nose poke, and receptacle entry. Pink and blue significance bars under traces denote time points where 99% bCIs are above or below 0 for at least 0.5 s, respectively. Horizontal scale = 1 s. Vertical scale = 1 Z%ΔF/F0. (H) Cohort averaged combined action bCI plot for subset of days used in cohort averaged heatmap Figure 3E. Trial level mean overlaid on 99% bCIs for tone onset, correct nose poke, and receptacle entry. Pink and blue significance bars under traces denote time points where 99% bCIs are above or below 0 for at least 0.5 s, respectively. Horizontal scale = 1 s. Vertical scale = 1 Z%ΔF/F0.
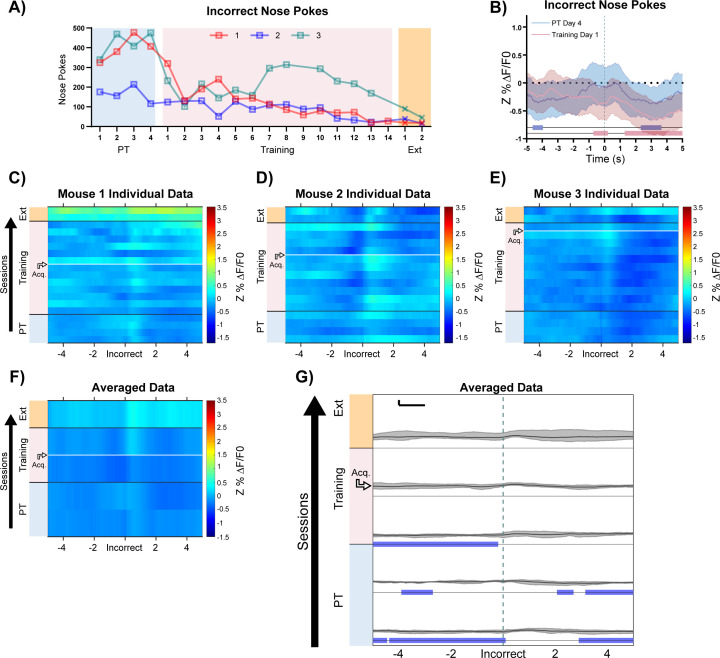
Figure 3—figure supplement 2. GCaMP6s recording in BLA CaMKIIα cells: incorrect nose pokes.

Figure 3—figure supplement 2.

(A) Incorrect nose pokes of individual mice throughout training. (B) Both incorrect nose pokes that yield timeouts (downsampled Training Day 1, pink line, n = 44 of 124) and incorrect nose pokes before timeouts are introduced (downsampled PT Day 4, blue line, n = 44 of 141) result in a modest decrease in BLA CaMKIIα neuron activity. Data from Mouse 1 as in Figure 3B, mean Z%ΔF/F0 overlaid on bootstrapped 99% confidence intervals (99% bCIs). Shaded significance bars under traces represent time points where 99% bCIs do not contain 0 for at least 0.5 s. (C–E) Individual mouse heatmaps of BLA CaMKIIα neuron activity across all training phases, aligned to incorrect nose poke. Each row is the average of incorrect nose pokes that led to (or would have led to for PT) a timeout across a session. Horizontal white line: acquisition threshold, when a mouse began to earn ~20 rewards consistently in Training. Black horizontal lines: divisions between training phases. (F) Heatmap of BLA CaMKIIα neuron activity during incorrect nose poke averaged across mice. Signal aligned as in (C-E) with a selection of data from key days in the behavioral paradigm shown. From bottom to top: PT Day 1, PT Day 4, Early Training Day, Acquisition Day (white horizontal line), Last Extinction Day. (G) Cohort averaged bCI plot for subset of days used in (F). Trial level mean (downsampled to 20) overlaid on 99% bCIs for incorrect nose poke. Pink and blue significance bars under traces denote time points where 99% bCIs are above or below 0 for at least 0.5 s, respectively. It is unclear how to interpret the substantial number of time points significantly below 0 before and after incorrect nose pokes and may be an artifact. Horizontal scale = 1 s. Vertical scale = 1 Z%ΔF/F0.
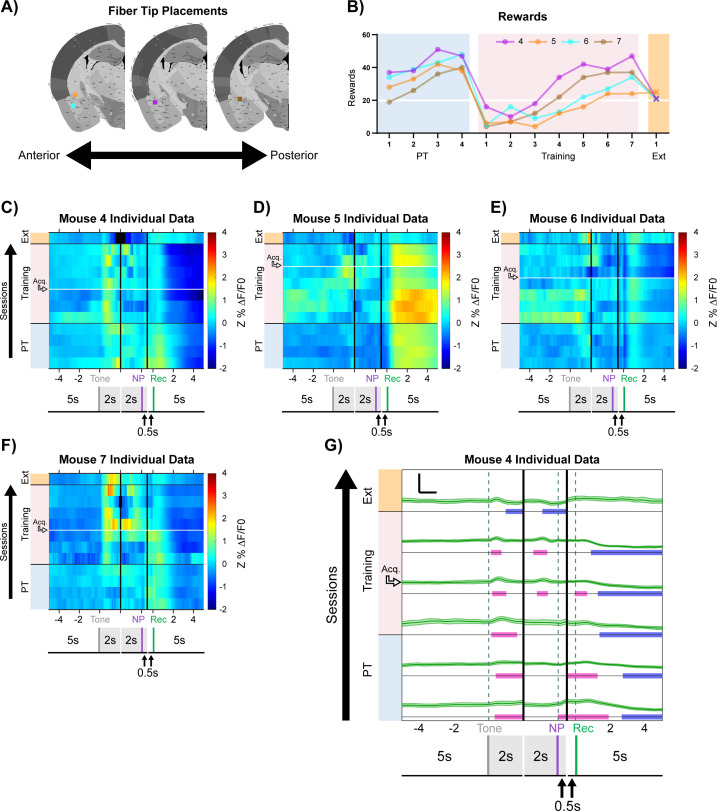
Figure 3—figure supplement 3. GCaMP6s recording in BLA CaMKIIα replicate.

Figure 3—figure supplement 3.

(A) Squares indicate optical fiber tips for individual mice. 4 (purple), 5 (orange), 6 (cyan), 7 (brown). (B) Behavioral responses of mice during BLA CaMKIIα GCaMP6s recordings. Individual mice acquired the task at different rates as measured by rewards earned. White horizontal line: acquisition threshold, when a mouse began to earn 20 rewards consistently in Training. Incorrect nose pokes shown in Figure 3—figure supplement 4A. (C–F) Heatmaps of BLA CaMKIIα cell activity in mice 4–7 across all training phases, aligned to tone onset (Tone), correct nose poke (NP), and receptacle entry (Rec). Each row is the average of rewarded trials across a training session. Horizontal white line: acquisition threshold, when a mouse began to earn 20 rewards consistently in Training. Black horizontal lines: divisions between training phases. Black vertical lines: divisions between breaks in time to allow for variable latencies in tone onset, correct nose poke, and receptacle entry (reward retrieval). Blanks in the heatmaps indicate time bins added for alignment. (G) Mouse 4 combined action bCI plot for subset of days, from bottom to top: PT Day 1, PT Day 4, Early Training Day, Acquisition Day, Last Training Day, Last Extinction Day. Mean overlaid on 99% bCIs for tone onset, correct nose poke, and receptacle entry. Pink and blue significance bars under traces denote time points where 99% bCIs are above or below 0 for at least 0.5 s, respectively. Horizontal scale = 1 s. Vertical scale = 5 Z%ΔF/F0.
Figure 3—figure supplement 4. GCaMP6s recording in BLA CaMKIIα replicate: incorrect nose pokes.

Figure 3—figure supplement 4.

(A) Incorrect nose poking of individual mice throughout training. (B–E) Individual mouse heatmaps of BLA CaMKIIα cell activity across all training phases, aligned to incorrect nose poke. Each row is the average of incorrect nose pokes that led to (or would have led to for PT) a timeout across a session. Horizontal white line: acquisition threshold, when a mouse began to earn 20 rewards consistently in Training. Black horizontal lines: divisions between training phases.