. 2020 Sep 18;9:e57335. doi: 10.7554/eLife.57335

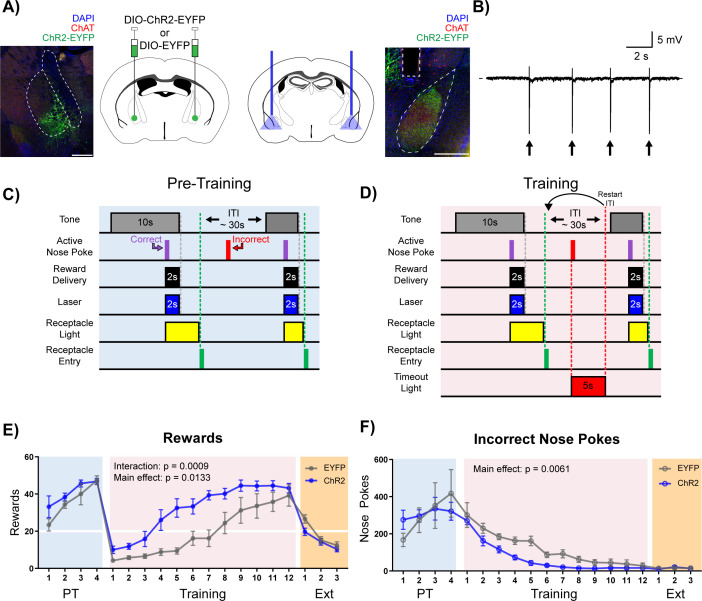
Figure 4. Stimulation of cholinergic terminal fibers in the BLA enhances cue-reward learning.

(A) Schematic of optical stimulation of ChAT+ terminal fibers projecting to the BLA. Left: Bilateral AAV injection into the NBM of ChAT-IRES-Cre mice to gain optical control over ChAT+ NBM cells and representative coronal brain slice showing ChR2-EYFP expression. White dashed lines: internal capsule and globus pallidus outlines. Blue: DAPI, red: ChAT, green: ChR2-EYFP. Scale: 500 µm, individual injection sites shown in Figure 4—figure supplement 1A and separate channels shown in Figure 4—figure supplement 1B. Right: Bilateral optical fiber implantation above BLA to stimulate BLA-projecting ChAT+ NBM cells. Representative coronal brain slice showing ChR2-EFYP expression and fiber tip placement. Gray dashed rectangle: fiber tract. White dashed: BLA outline. Blue: DAPI, red: ChAT, green: ChR2-EYFP. Scale: 500 µm, individual fiber tip placements shown in Figure 4—figure supplement 1C and separate channels shown in Figure 4—figure supplement 1D. Injection sites and fiber tip placements for males from Figure 4—figure supplement 3C–F shown in Figure 4—figure supplement 4A–B. (B) Optical stimulation validation via local field potential recordings. Extracellular recording of action potentials induced by optical stimulation of ChAT+ NBM cells expressing ChR2. Arrows indicate 60 ms laser pulse. (C–D) Details of the Cue-Reward Learning Paradigm (C) During Pre-Training, auditory tones were presented on a variable interval 30 schedule (VI30), during which an active nose poke (correct) yielded Ensure reward delivery and 2 s of optical stimulation but there was no consequence for incorrect nose pokes (active nose pokes not during tone). (D) Training was identical to Pre-Training, except incorrect nose pokes resulted in a 5 s timeout, signaled by house light illumination, followed by a restarting of the ITI. (E) Behavioral performance in a cue-reward learning task improves with optical stimulation of ChAT+ fibers in BLA. EYFP- and ChR2-expressing mice earn similar numbers of rewards during PT (blue shaded region). ChR2-expressing mice more rapidly earn significantly more rewards than EYFP-expressing mice during Training (pink shaded region). No significant differences were observed during extinction training (orange shaded region). Horizontal white line: acquisition threshold, when a mouse began to earn ~20 rewards consistently in Training. Mean ± SEM, EYFP: n = 5, ChR2: n = 6. Individual data are shown in Figure 4—figure supplement 3A. Data for males shown in Figure 4—figure supplement 3C,E. (F) EYFP- and ChR2-expressing mice made similar numbers of incorrect nose pokes during Pre-Training. ChR2-epxressing mice made significantly fewer incorrect nose pokes than EYFP-expressing mice in Training. No significant differences were observed during extinction training. Mean ± SEM, EYFP: n = 5, ChR2: n = 6. Individual data are shown in Figure 4—figure supplement 3B. Data for males shown in Figure 4—figure supplement 3D,F. Additional behavioral assays shown in Figure 4—figure supplement 5A–F.

Figure 4.

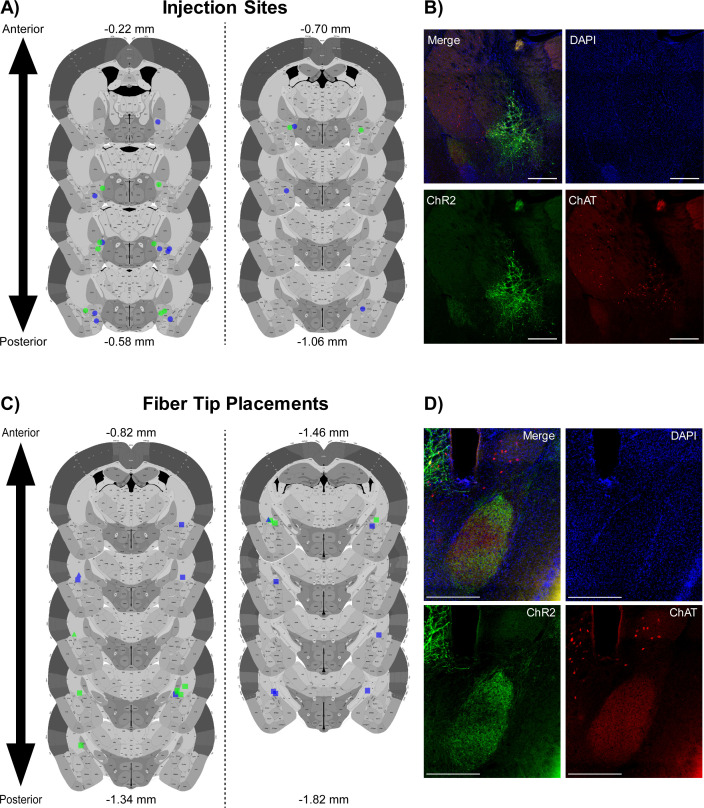
Figure 4—figure supplement 1. Injection sites and optical fiber placements.

Figure 4—figure supplement 1.

(A) Circles indicate NBM injection sites for individual mice, EYFP (green) and ChR2 (blue). Anterior/Posterior position relative to Bregma indicated. (B) Representative injection site coronal slice from Figure 4A with channels separated. Scale = 500 µm. (C) Squares indicate observable optical fiber tips for individual mice, EYFP- (green) and ChR2-expressing mice (blue). Triangles indicate estimated optical fiber tips based on adjacent slices. Anterior/Posterior position relative to Bregma indicated. (D) Representative fiber tip site coronal slice from Figure 4A with channels separated. Scale = 500.
Figure 4—figure supplement 2. Ex vivo electrophysiology.
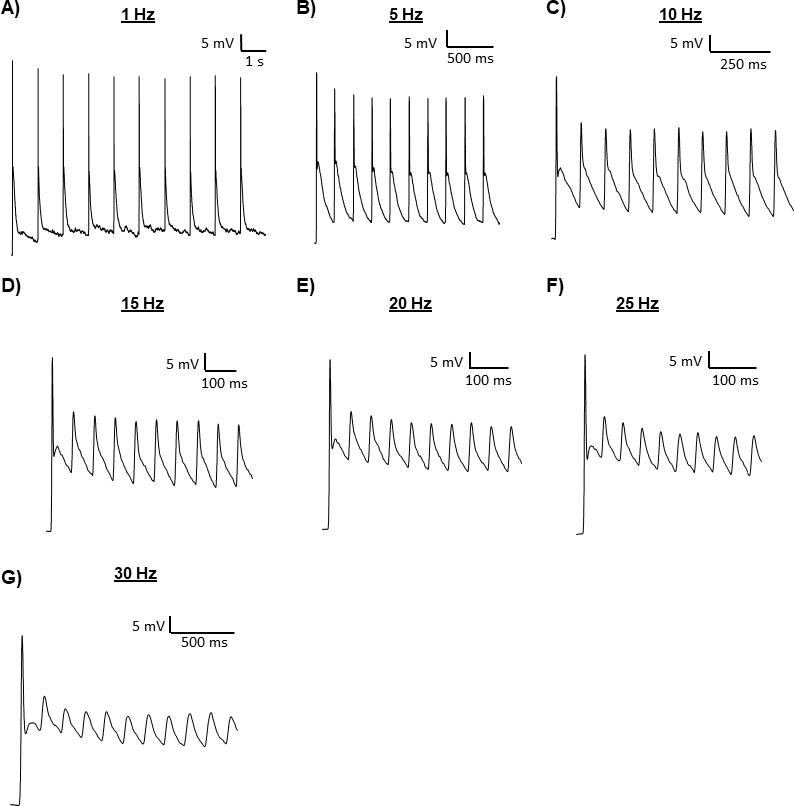
Figure 4—figure supplement 2.

(A–G) Current clamp recordings of ChAT+ NBM cells expressing ChR2. Optical stimulation was delivered at the indicated frequency.
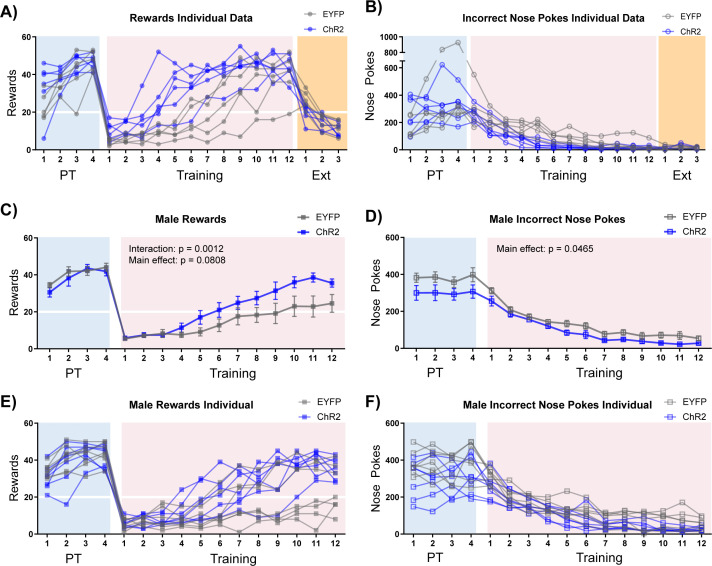
Figure 4—figure supplement 3. Individual behavioral data and male cohort.

Figure 4—figure supplement 3.

(A) Rewards earned for individual mice from Figure 4E. Horizontal white line: acquisition threshold, when a mouse began to earn ~20 rewards consistently in Training. (B) Incorrect nose pokes for individual mice from Figure 4F. (C) Optical stimulation of ChAT+ NBM-BLA terminal fibers (ChR2-expressing mice, blue squares) had a similar effect on rewards earned during Training in male mice compared to female mice. Mean ± SEM, EYFP: n = 7, ChR2: n = 7. Horizontal white line: acquisition threshold, when a mouse began to earn ~20 rewards consistently in Training. (D) Optical stimulation of ChAT+ NBM-BLA terminal fibers (ChR2-expressing mice, blue squares) had a similar effect on incorrect nose pokes during Training in male mice compared to female mice. Mean ± SEM, EYFP: n = 7, ChR2: n = 7. (E) Individual data for graph shown in C. (F) Individual data for graph shown in D.
Figure 4—figure supplement 4. Injection sites and optical fiber placements.

Figure 4—figure supplement 4.

(A) Circles indicate NBM injection sites for individual mice, EYFP- (green), and ChR2-expressing mice (blue). Anterior/Posterior position relative to Bregma indicated. (B) Squares indicate observable optical fiber tips for individual mice, EYFP- (green), and ChR2-expressing mice (blue). Triangles indicate estimated site of optical fiber tips based on adjacent slices. Anterior/Posterior position relative to Bregma indicated.
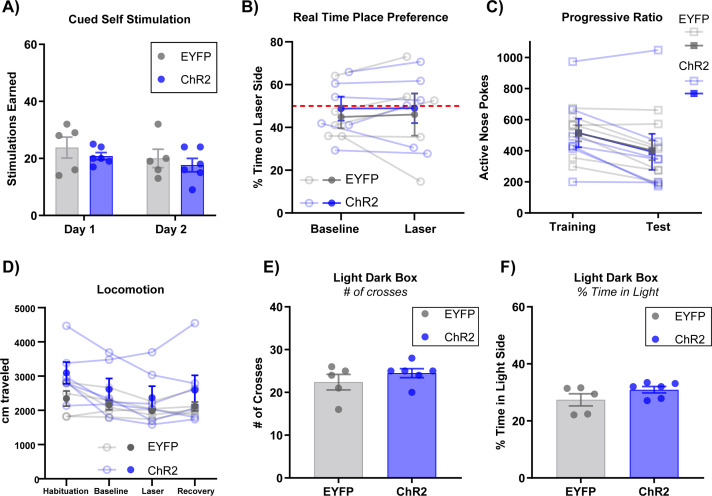
Figure 4—figure supplement 5. Additional behavioral assays with NBM-BLA optical stimulation.

Figure 4—figure supplement 5.

(A) Stimulation of ChAT+ NBM-BLA terminal fibers did not support self-stimulation. Mice were allowed to nose poke for 2 s of stimulation in the Training paradigm. Data for female mice from Figure 4, Figure 4—figure supplement 1, Figure 4—figure supplement 3A–B. (B) Stimulation of ChAT+ NBM-BLA terminal fibers did not support real time place preference. Mice were allowed to move freely between two sides of an empty cage with distinct floor contexts for 15 min. Data are reported as percent time spent on the laser-paired side. Closed circles: Mean ± SEM, open circles: data for individual mice. Data for female mice from Figure 4, Figure 4—figure supplement 1, Figure 4—figure supplement 3A–B. (C) Stimulation of ChAT+ NBM-BLA terminal fibers during a progressive ratio test did not affect active nose poking. Closed squares: Mean ± SEM, open squares: individual mice. Data for male mice from Figure 4—figure supplement 3C–F + 4. (D) There were no differences between EYFP- and ChR2-expressing mice in locomotor activity. X-axis ticks = 5 min bins, Laser = 5 min of 20 s on/off optical stimulation. Closed circles: Mean ± SEM, open circles: data for individual mice. Data for female mice from Figure 4, Figure 4—figure supplement 1, Figure 4—figure supplement 3A–B. (E–F) No difference in behavior was seen between EYFP- and ChR2-expressing mice on any measures in the Light/Dark Box Test. Data for female mice from Figure 4, Figure 4—figure supplement 1, Figure 4—figure supplement 3A–B.