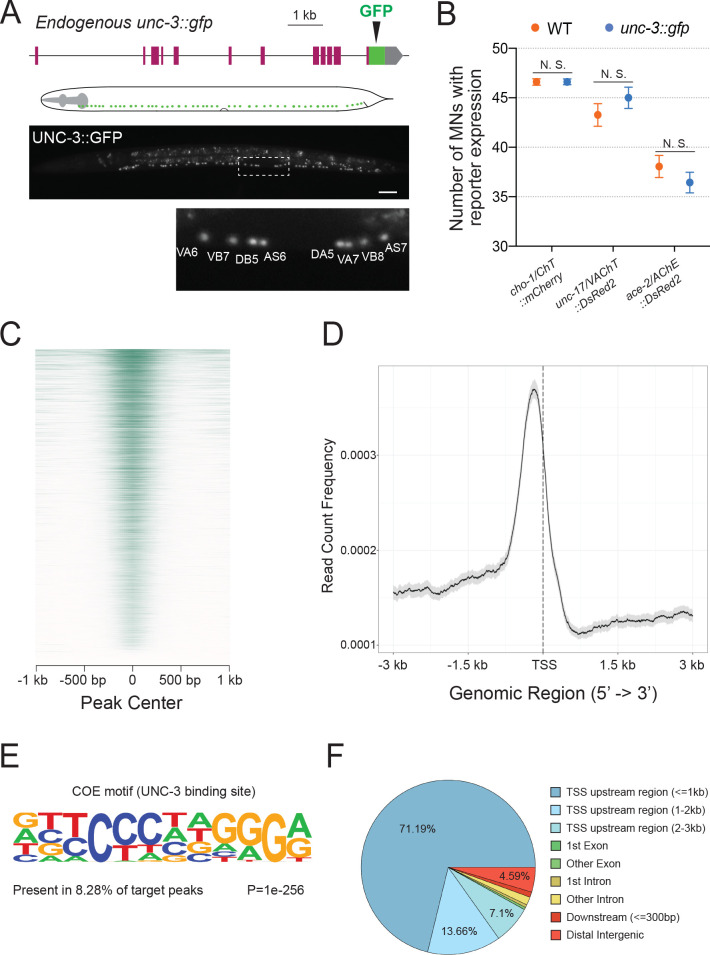
Figure 1. Mapping UNC-3 binding genome-wide with ChIP-Seq.
(A) Diagram illustrating the endogenous reporter allele of UNC-3. GFP is inserted immediately upstream of unc-3’s stop codon. Below, a representative image at L2 stage showing expression of UNC-3::GFP fusion protein in cholinergic MN nuclei. Region highlighted in dashed box is enlarged. Scale bar, 20 μm. (B) Quantification of terminal identity gene markers that report expression of known UNC-3 targets (cho-1/ChT, unc-17/VAChT, ace-2/AChE) in WT and ot839 [unc-3::gfp] animals at the L4 stage (N = 15). N. S.: not significant. (C) Heatmap of UNC-3 ChIP-Seq signal around 1.0 kb of the center of the binding peak. (D) Summary plot of UNC-3 ChIP-Seq signal with a 95% confidence interval (gray area) around 3.0 kb of the TSS. The average signal peak is detected at ~200 bp upstream of the TSS. (E) de novo motif discovery analysis of 6,892 UNC-3 binding peaks identifies a 12 bp-long UNC-3 binding motif. (F) Pie chart summarizes genomic distribution of UNC-3 ChIP-Seq signal.


