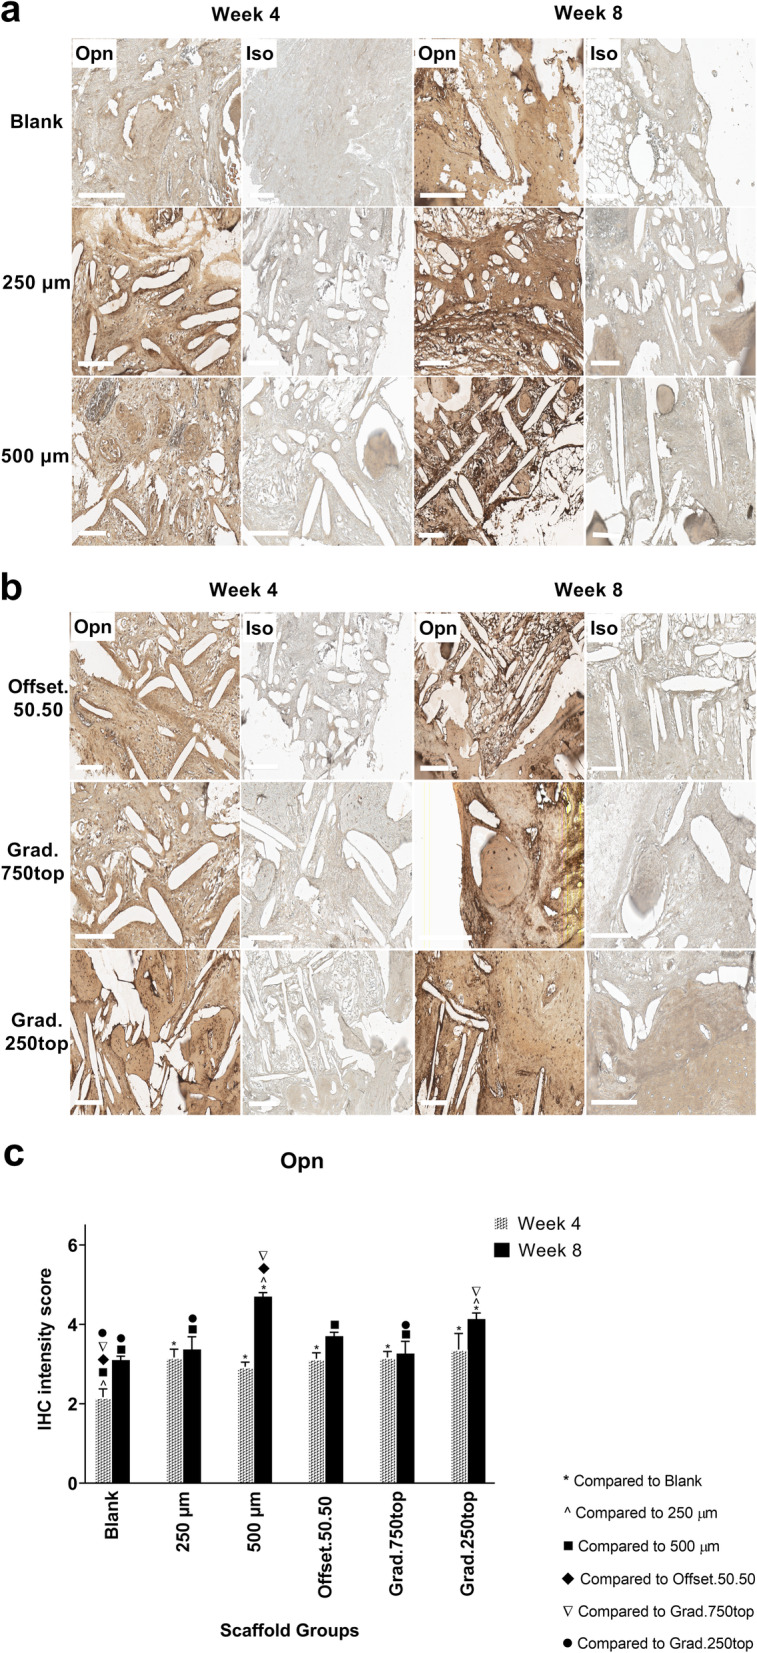
Fig. 11.

IHC analysis of Opn in calvarial defect of rat 4 and 8 weeks of post-implantation of the MEW PCL scaffolds. a) Blank (defect control without implanted scaffold), 250 μm, 500 μm. b) Offset.50.50, Grad.750top, Grad.250top. Opn: Osteopontin staining, Iso: Isotype control. The white bar represents 200 μm.c) Quantitative analysis at weeks 4 and 8. The values expressed are the mean ± SD (n = 3). Statistically significant differences between mean Opn intensity scores for the treatment groups when compared to the other groups were determined by ANOVA (Significant: * p < 0.0001, ^ p = 0.0004, ■ p < 0.0001, ♦ p = 0.0006, ▼p = 0.0004, ● p = 0.002)
