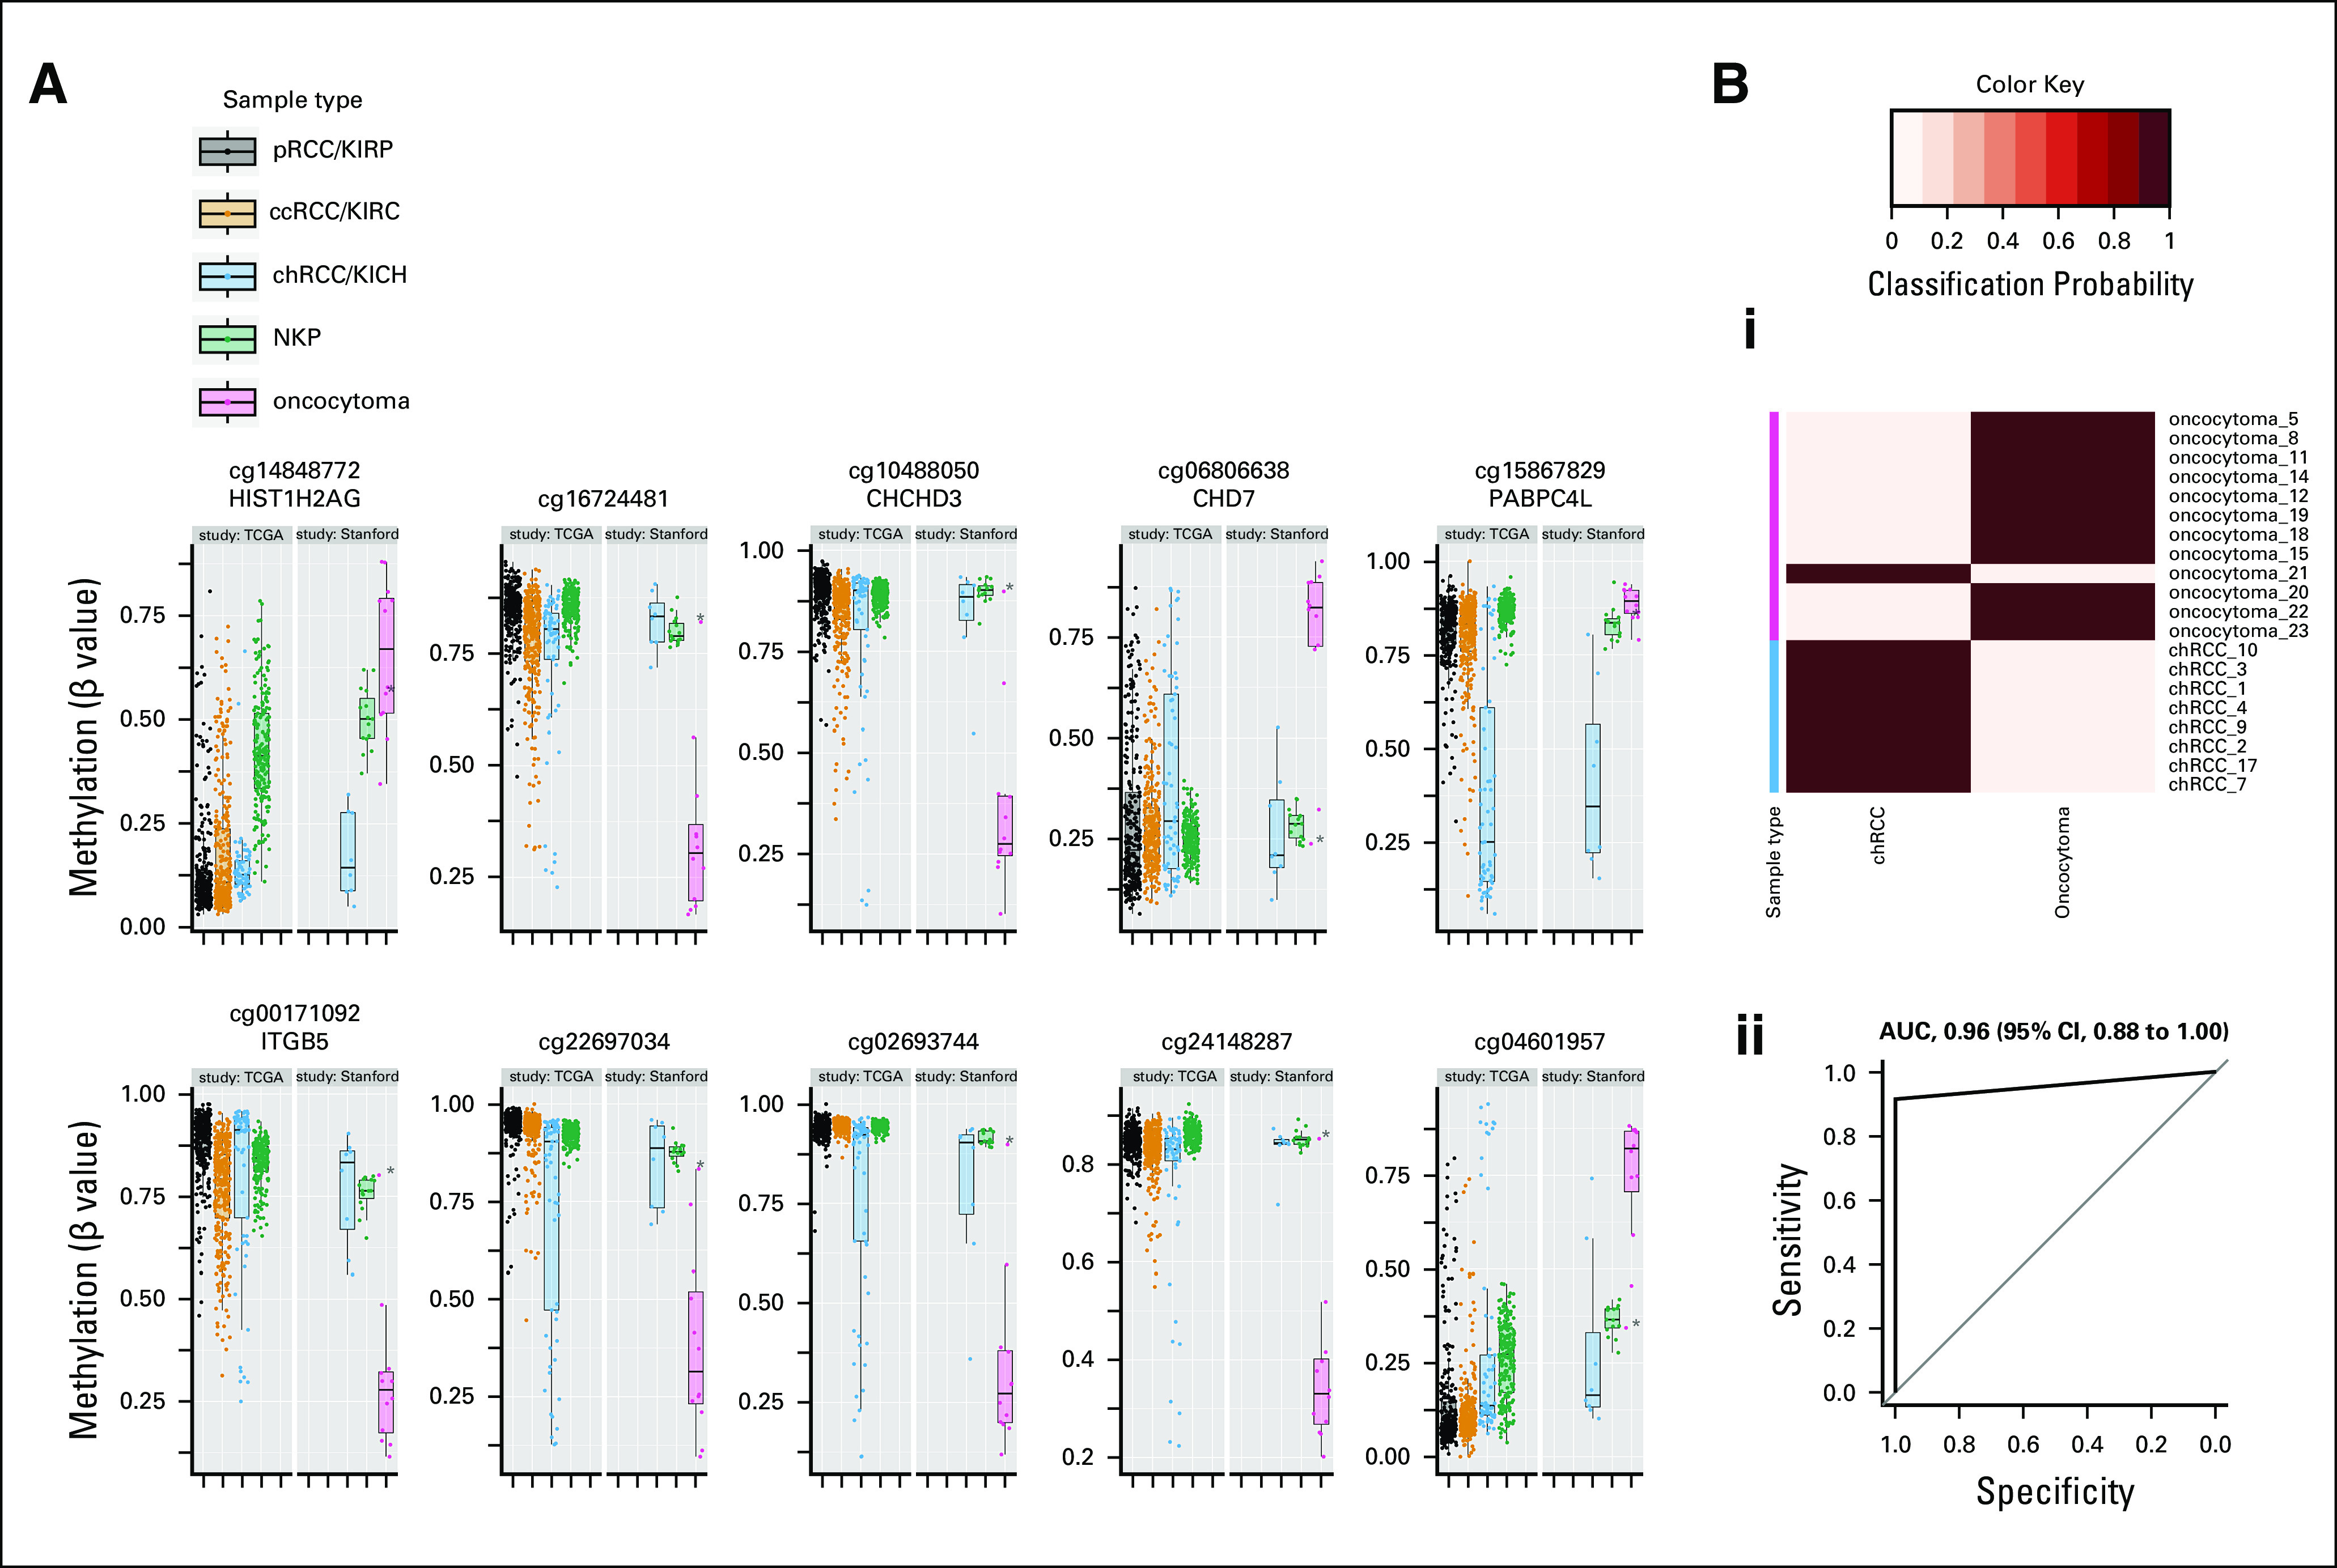
FIG 3.

Differential methylation distinguishing oncocytoma from chRCC. (A) Box plots illustrate methylation of cytosine-phosphate-guanine sites (CpGs) that were differentially methylated between oncocytoma and chRCC within Stanford study data. Included are the top 10 statistically significant CpGs with the greatest mean methylation differences between oncocytoma and chRCC. Methylation of the same CpGs in TCGA data for tumors in all three RCC subtypes (pRCC, ccRCC, and chRCC) and NKP are shown for reference. Points represent individual patient samples. (B) Differential classification of chRCC versus oncocytoma based on differential methylation of 79 CpGs (including those illustrated in A): (i) Heatmap indicating the posterior probabilities (classification probability) for classification of patient samples as either chRCC or oncocytoma by a diagnostic model (prediction of microarrays analysis13) in combination with 10-fold cross-validation. The true histological class of each sample is indicated by the color key, and the probabilities for belonging to each of the two tumor type classes (chRCC or oncocytoma) are indicated in columns by the heatmap color gradient. (ii) Received operating indicating the overall classification of the diagnostic model. The AUC is indicated with 95% CIs. (*) Misclassified sample (oncocytoma 21). AUC, area under the receiver operating curve; ccRCC, clear-cell renal cell carcinoma; chRCC, chromophobe renal cell carcinoma; kidney chromophobe (TCGA study abbreviation); KIRC, kidney renal clear cell carcinoma (TCGA study abbreviation); KIRP, kidney renal papillary cell carcinoma (TCGA study abbreviation); NKP, normal kidney parenchyma; pRCC, papillary renal cell carcinoma; TCGA, The Cancer Genome Atlas.
