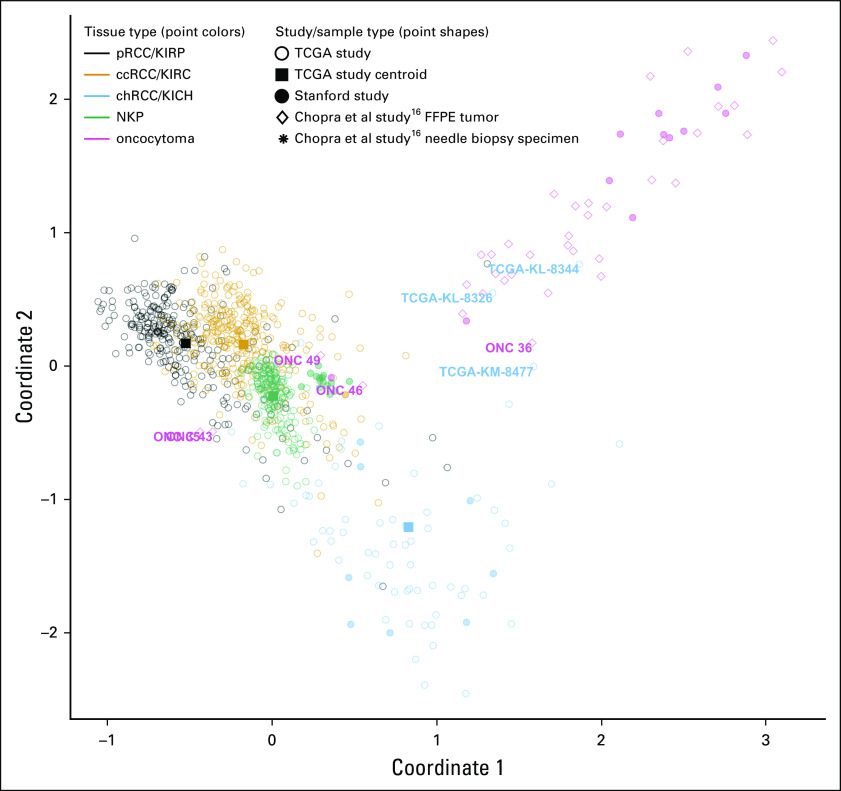
FIG 5.
Multidimensional scaling plot illustrating similarity of tumors from the Chopra et al study16 to Stanford and TCGA samples based on the diagnostic methylation signature. Multidimensional scaling (MDS) plots illustrating patient samples from three studies in terms of their DNA profiles. Classic MDS was applied to methylation data for 61 cytosine-phosphate-guanine sites (CpGs) that were included within the 79 CpGs model that could distinguish oncocytoma from chRCC (as illustrated in Fig 3B). These 61 CpGs represent those for which data were available for all three studies. Open circles represent TCGA patient samples. Filled squares represent centroids for each of the TCGA sample groups. Closed circles represent Stanford study patient samples. MDS illustrates the similarity of Chopra et al16 study tumors to each of the sample classes. Text labels indicate samples that were misclassified by our methylation models. ccRCC, clear-cell renal cell carcinoma; chRCC, chromophobe renal cell carcinoma; FFPE, formalin-fixed, paraffin-embedded; KICH, kidney chromophobe (TCGA study abbreviation); KIRC, kidney renal clear cell carcinoma (TCGA study abbreviation); KIRP, kidney renal papillary cell carcinoma (TCGA study abbreviation); NKP, normal kidney parenchyma; pRCC, papillary renal cell carcinoma; TCGA, The Cancer Genome Atlas.

