
Figure 1.
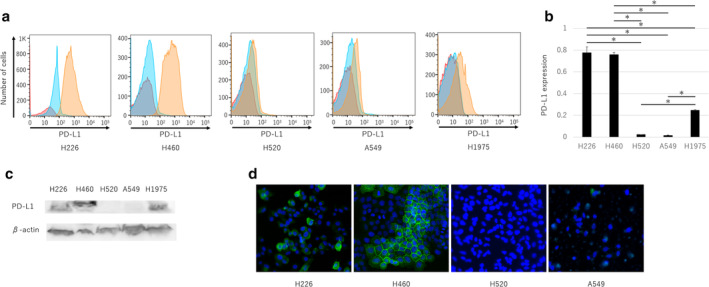
Programmed death‐ligand 1 (PD‐L1) expression and miRNA in human lung cancer cell lines H226, H460, H560, H1975, and A549. (a) Flow cytometry was used to evaluate PD‐L1 expression in each cell line (red, unstained; blue, isotype control; orange, APC‐PD‐L1). (b) PD‐L1 expression presented as the means ± standard error of the mean (SEM) of three independent flow cytometry assays. (c) Western blotting was used to evaluate the expression of PD‐L1 and β‐actin. (d) PD‐L1 expression was evaluated using immunofluorescence staining (green, GFP‐PD‐L1; blue, DAPI‐cell nucleus). The P‐values were determined using the Mann‐Whitney U test (*P < 0.05).