
Figure 3.
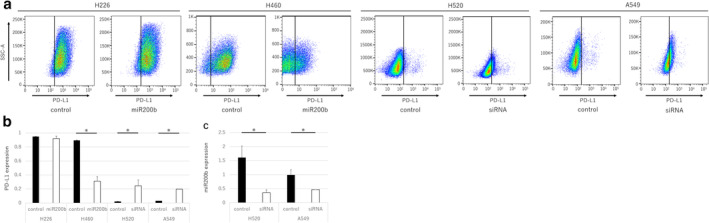
Expression of PD‐L1 and miR200b after transfection with mimic miR200b or miR200b siRNA. (a) Flow cytometry was used to evaluate PD‐L1 expression in H226, H460, H520, and A549 cells after transfection with a control miRNA, mimic miR200b, or S‐TuD. (b) PD‐L1 expression based on three independent assays. (c) miR200b expression in H520 and A549 cells after transfection with the control miRNA and S‐TuD based on three independent RT‐qPCR assays. Data are presented as the mean ± SEM, and the P‐values were determined using the Mann‐Whitney U test (*P < 0.05).