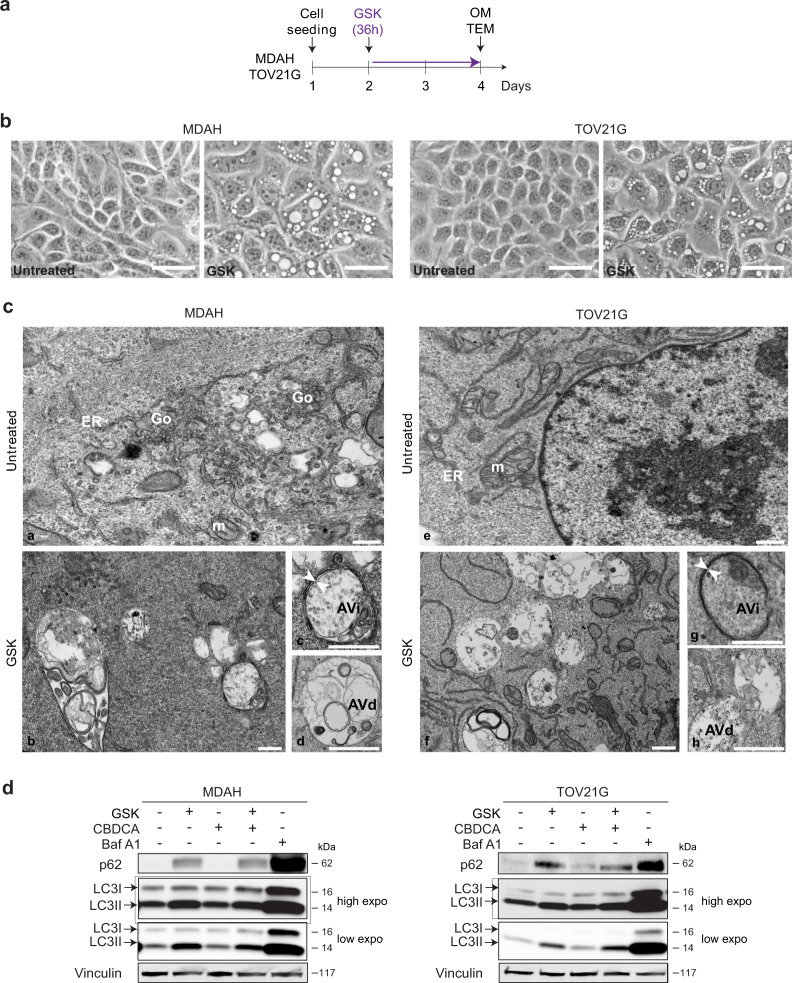
Fig. 4. SGK2 inhibition alters autophagic flux.
a Experimental timeline of cells studied with optical (OM) and transmission electron microscopy (TEM). MDAH and TOV21G cells were treated with GSK650394 (GSK) 35 µM for 36 h. b Representative optical microscopy pictures of MDAH and TOV21G cells treated or not with GSK650394 (GSK) as reported in a. Cytoplasmic vacuoles are present only in GSK650394 (GSK) treated cells. Scale bars = 50 µm. c TEM ultrastructure analyses of MDAH (left panels) and TOV21G (right panels) cells. a and e Untreated cells; b and f GSK650394-treated cells (GSK) showing cytoplasmic vacuoles accumulation; c and g Magnification of initial autophagic vacuoles (AVi) (white arrowheads indicate double-membrane) and degradative autophagic vacuoles (AVd) vacuoles (d and h). Highlighted intracellular organelles in untreated cells are endoplasmic reticulum (ER), Mitochondrion (m) and Golgi apparatus (Go). Scale bar: 300 nm. d Western blot analyses evaluating the expression of the autophagy markers LC3I/LC3II and p62 in MDAH and TOV21G cells, treated with GSK650394 35 μM (36 h), CBDCA 140 μg/ml (16 h) and GSK+CBDCA (as in Fig. 2d) compared to the effect of Bafilomycin A1 (Baf A1). Vinculin was used as loading control. (See also Figs. S5 and S6).

