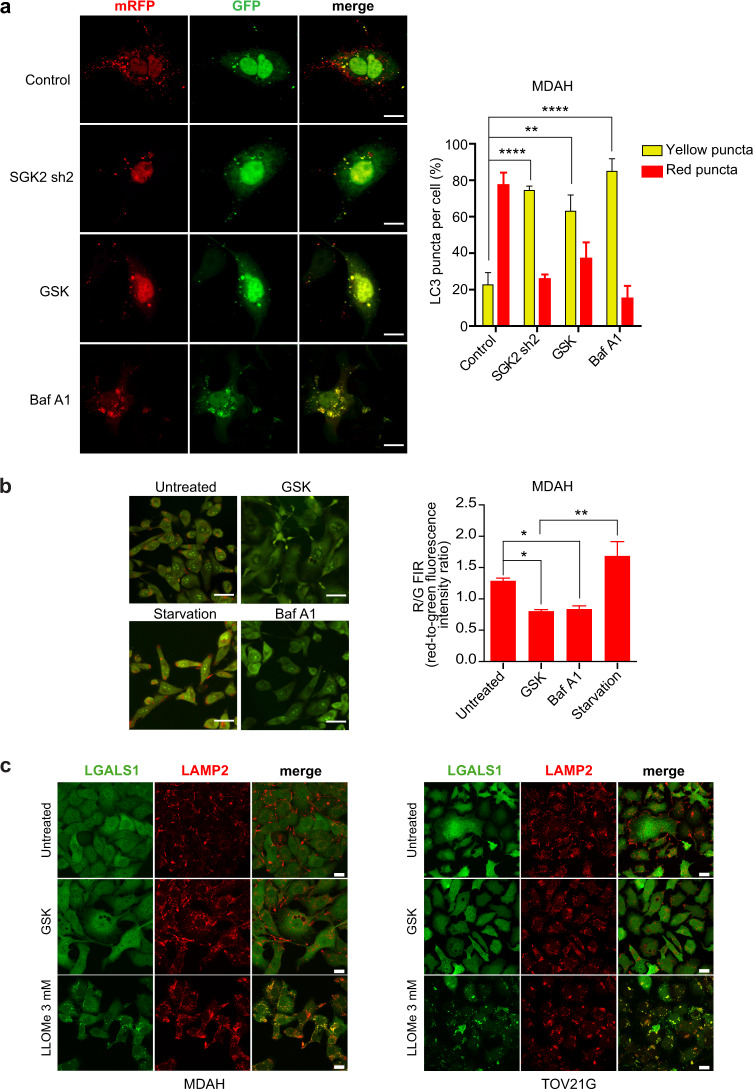
Fig. 5. SGK2 inhibition alters acidification of vacuolar cellular compartment.
a Representative pictures of confocal microscopy analyses of MDAH cells transfected with mRFP-GFP-LC3 untreated (Control), treated with GSK650394 35 μM for 36 h (GSK) or with Bafilomycin A1 0.2 μM for 30 min (Baf A1) or transduced with SGK2 shRNA (SGK2 sh2) (scale bar: 12 μm). The graph on the right reports the percentage of yellow/red LC3 puncta counted per cell (number of cells/experimental condition = 15–20). b Representative pictures of confocal microscopy analyses of MDAH cells treated or not with GSK650394 35 μM (GSK) for 36 h and then stained with acridine orange. Cells serum-starved for 4 h (Starvation) or treated with Bafilomycin A1 0.2 μM for 30 min (Baf A1) were used as positive and negative controls, respectively (scale bar: 18 μm). On the right, the graph reports the average red-to-green fluorescence intensity ratio (number of fields evaluated per condition = 8–10). c Representative pictures of confocal microscopy analyses for the evaluation of LGALS1 (galectin-1, green) and LAMP2 (red) staining of MDAH (left) and TOV21G (right) cells treated or not with GSK650394 35 μM (GSK) or LLOMe 3 mM (used as positive control of LMP (Lysosomal Membrane Permeabilization)) and then evaluating LGALS1 (galectin-1, green) (Scale bar: 20 μm).

