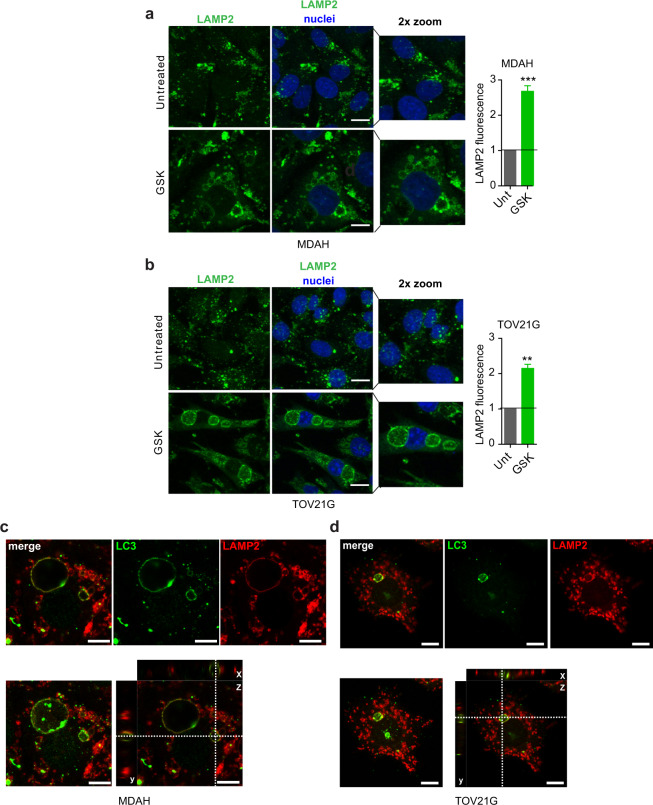
Fig. 6. SGK2 inhibition induces the accumulation of autophagolysosomes.
Representative pictures of confocal microscopy immunofluorescence analyses evaluating the expression and localization of LAMP2 in untreated or GSK650394 (GSK)-treated MDAH a and TOV21G b cells. A zoomed area is reported for each condition. Nuclei were stained with propidium iodide and pseudo colored in blue (scale bars: 9 μm). Graphs on the right report the average LAMP2 fluorescence intensity per field (average number of cells evaluated per condition = 90 cells). Results are expressed as fold of green fluorescence respect to untreated. Representative pictures of confocal microscopy immunofluorescence analyses evaluating LC3 (green) and LAMP2 (red) expression and localization in MDAH c and TOV21G d cells treated with GSK650394. Upper panel shows a representative best focus plane with single and merged channels, as indicated. Lower panel shows the maximum projection (left) and the xyz projections (right) showing the co-immunostaining of LC3 and LAMP2 in a vacuole after GSK650394 treatment. Scale bar:10 μm. In the figure data are mean ± SD. Significance was calculated using two-tailed, unpaired Student’s t test. ***p < 0.001, **p < 0.01. (See also Fig. S7).

