Figure 1:

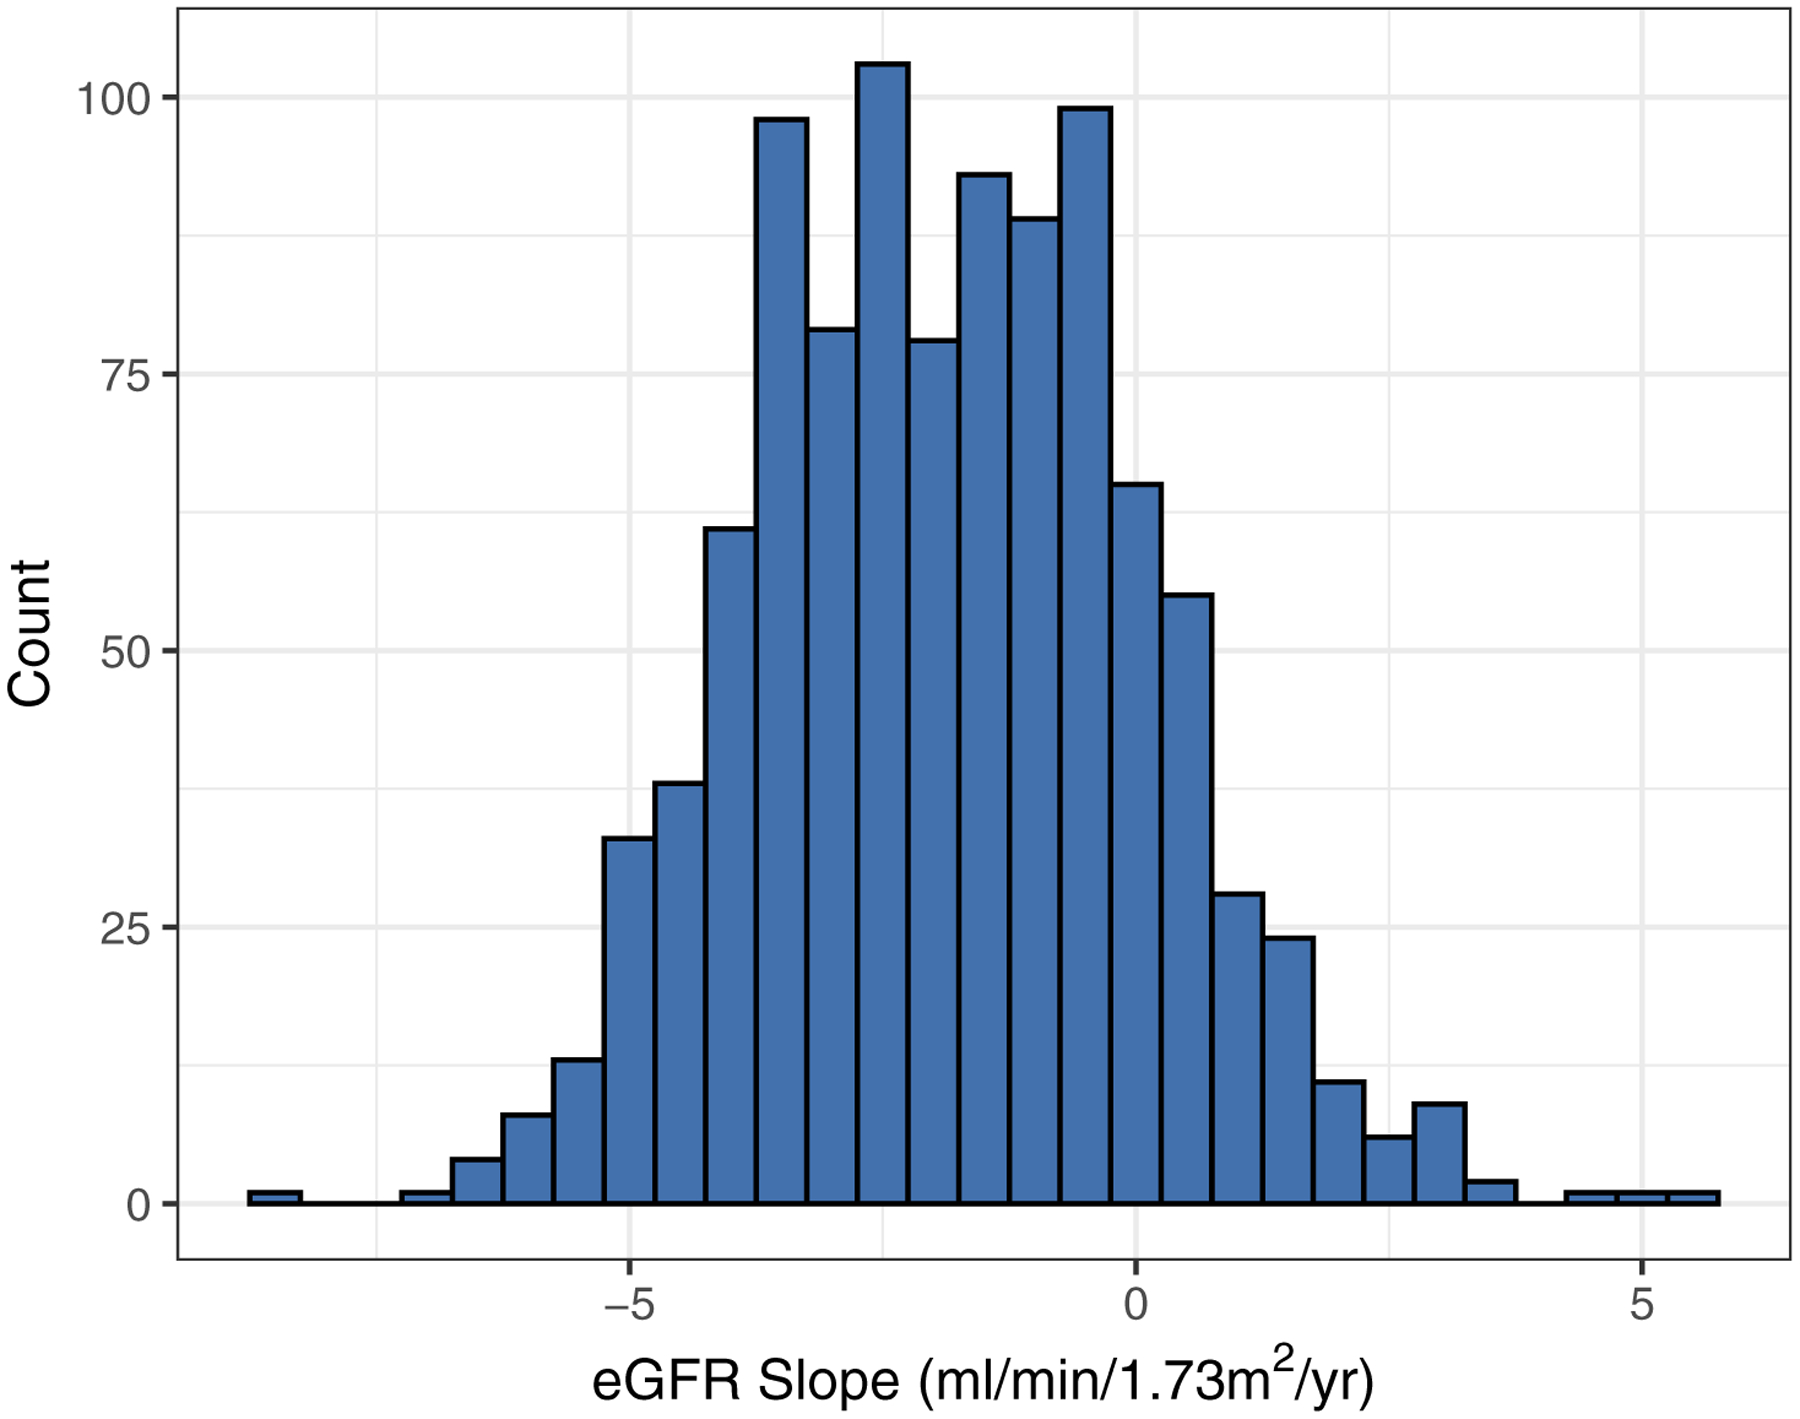
Histogram of predicted eGFR slopes (N=1001). The eGFR slopes were estimated via linear mixed effects model with a mean of −1.83 +/− 1.92 (SD) ml/min/1.73m2 per year.

Histogram of predicted eGFR slopes (N=1001). The eGFR slopes were estimated via linear mixed effects model with a mean of −1.83 +/− 1.92 (SD) ml/min/1.73m2 per year.