
Fig 4. Proportion of cancer cells which are intraductal.
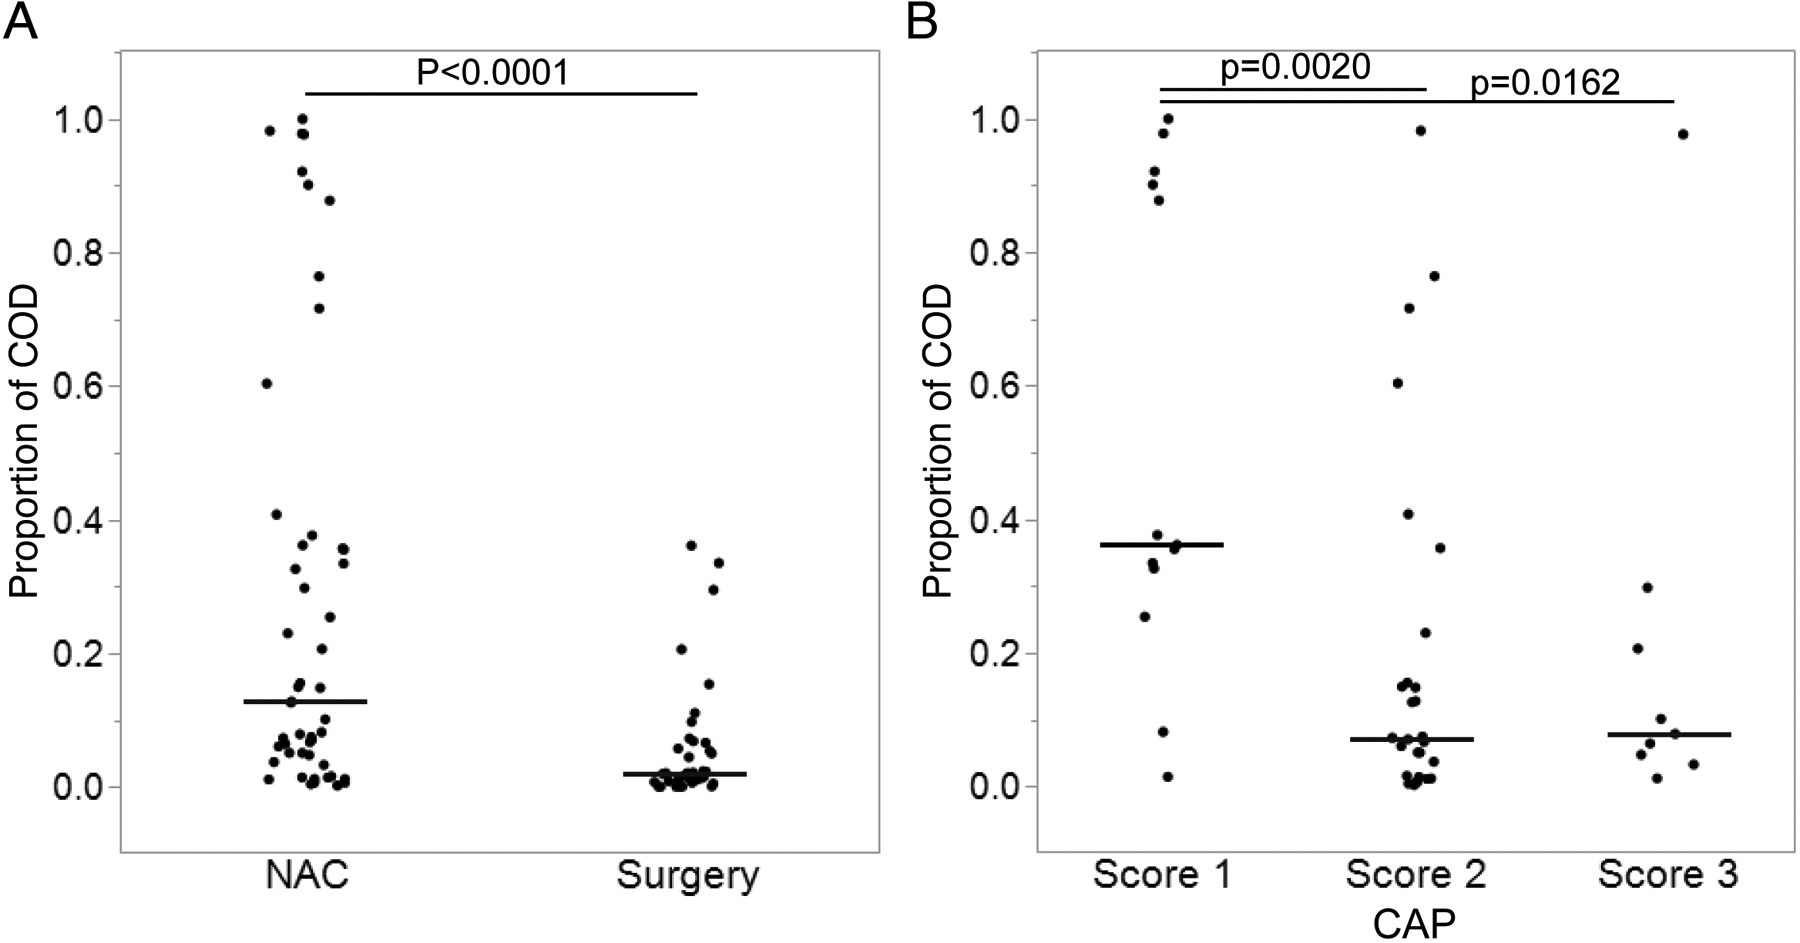
Data are presented as scatter dot plot with lines representing median. (A) Neoadjuvant chemotherapy (NAC) group versus Immediate surgery group. (B) College of American Pathologists (CAP) score 1–3.