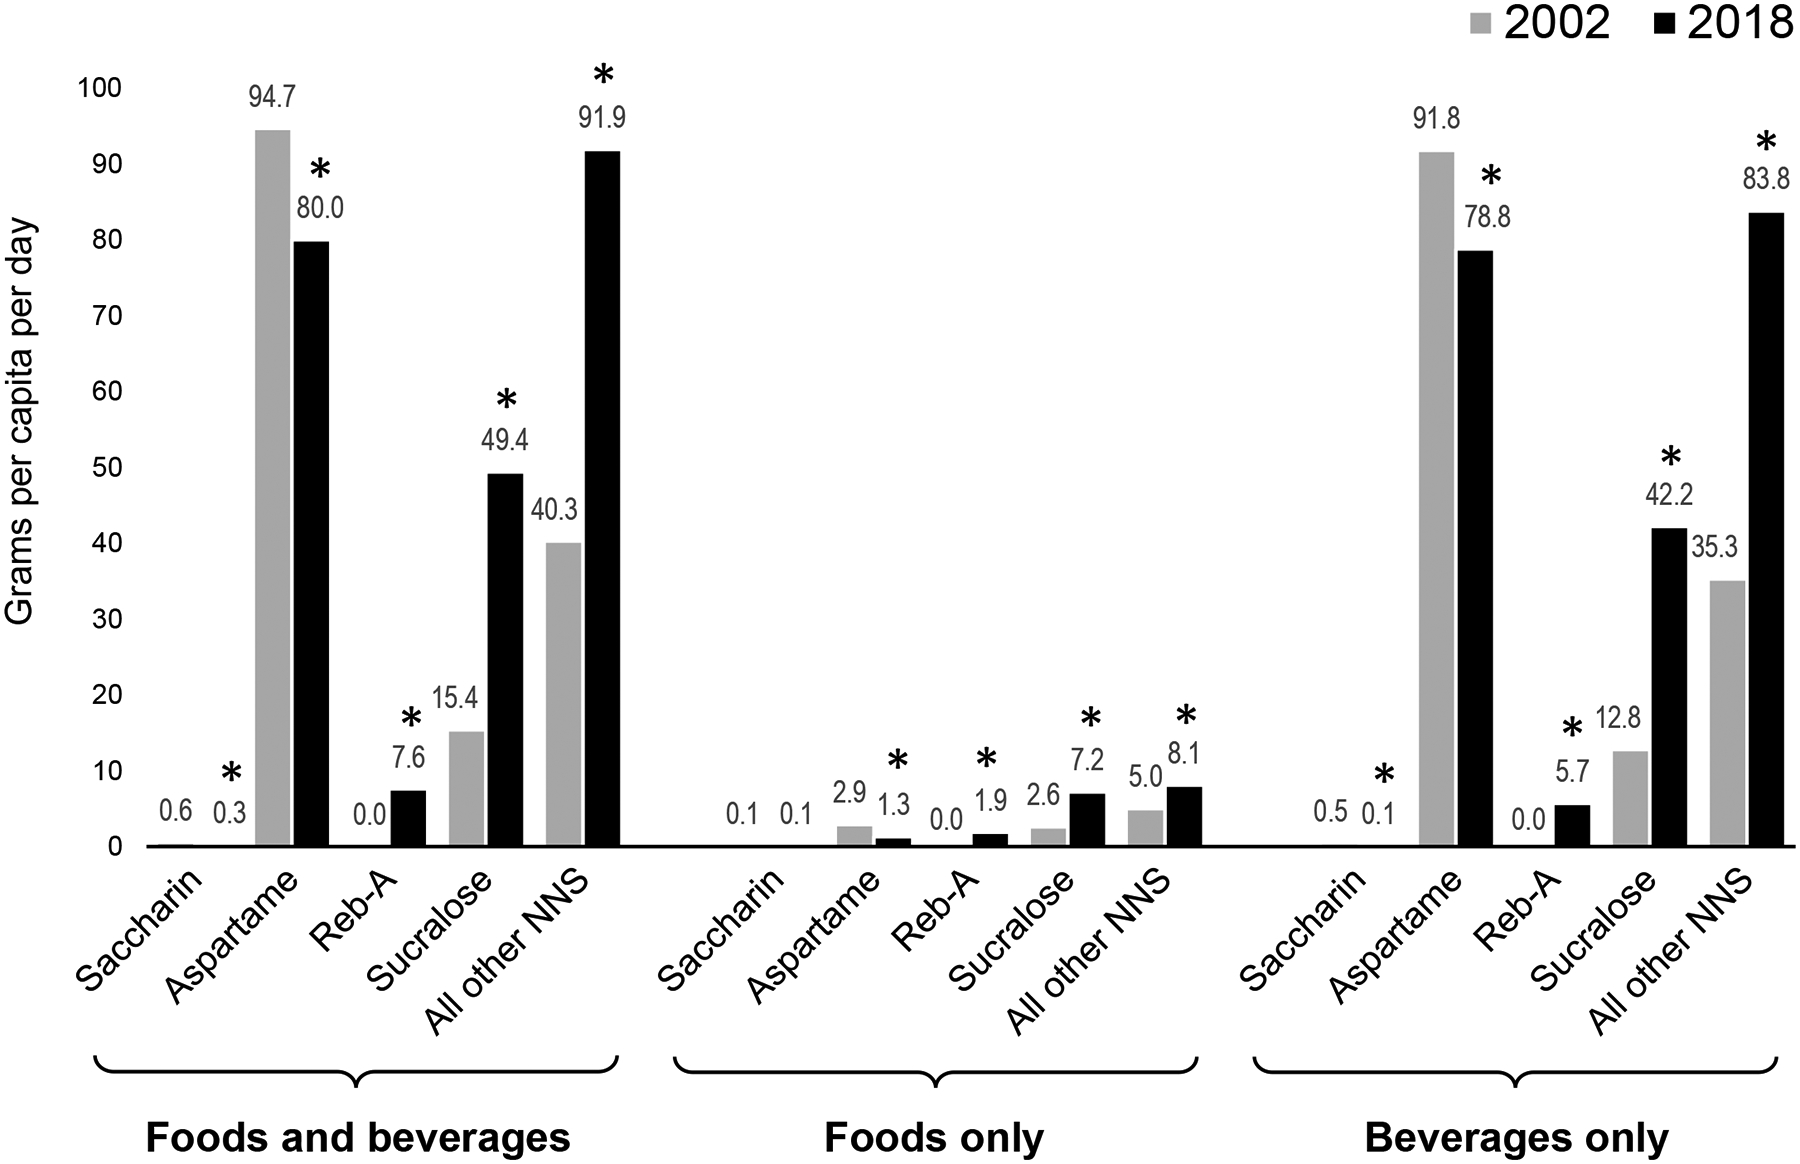
Figure 4: Estimated volume of food and beverage products containing specific types of non-nutritive sweeteners (NNS) purchased by U.S. householdsa in a comparison of 2002 vs. 2018.

a Sample sizes of households were 39,300 in 2002 and 61,101 in 2018. Authors’ calculations are based in part on data reported by Nielsen through its Homescan Services for all food categories, including beverages and alcohol for the years 2002 and 2018 from Nielsen Homescan Household Panel across the U.S. market, The Nielsen Company, 2019. The conclusions drawn from the Nielsen data are those of the authors and do not reflect the views of Nielsen. Nielsen is not responsible for and had no role in, and was not involved in, analyzing and preparing the results reported herein.
* P<0.05
