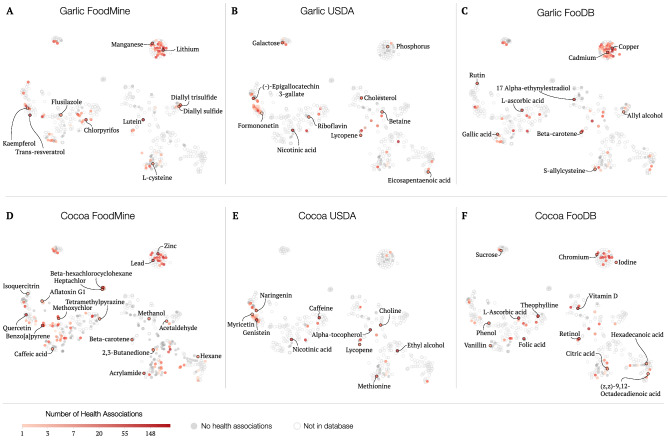
Figure 5.
TSNE dimensionality reduction of chemical embeddings with health associations. TSNE plots of Mol2Vec chemical embeddings for garlic (A–C) and cocoa (D–F). The colors of each data point encode the number of health implications associated with the compounds based on the CTD database. Dark gray represents chemicals with 0 health associations. We show chemicals catalogued by each studied database for FoodMine (A,D), USDA (B,E), and FooDB (C,F). Markers are filled if the database contains the chemical, and empty if it does not.

