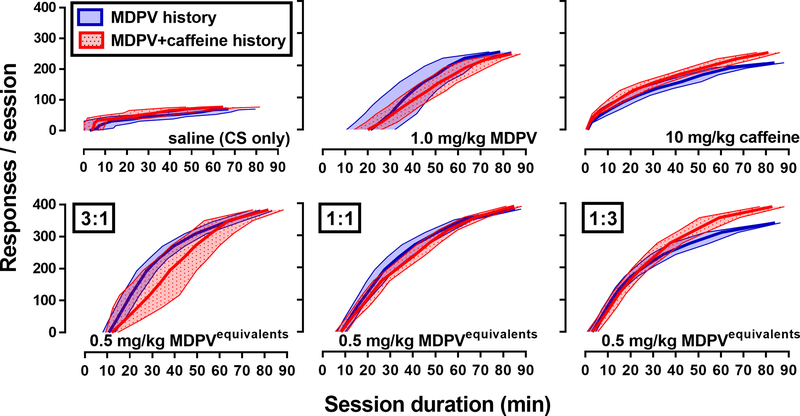
Figure 4.
Mean response pattern during the CS+drug tests for saline (upper left) and the most effective dose of MDPV (upper center), caffeine (upper right), and each fixed-dose mixture [3:1 (lower left), 1:1 (lower center), and 1:3 (lower right)]. Solid line represents the mean and shaded region represents the 95% confidence intervals for the response pattern in rats with a history of self-administering MDPV (blue; n=10) or a mixture of MDPV+caffeine (red; n=10). Abscissa: the session duration (min). Ordinates: total number of responses made on the active lever during the 90-min session.

