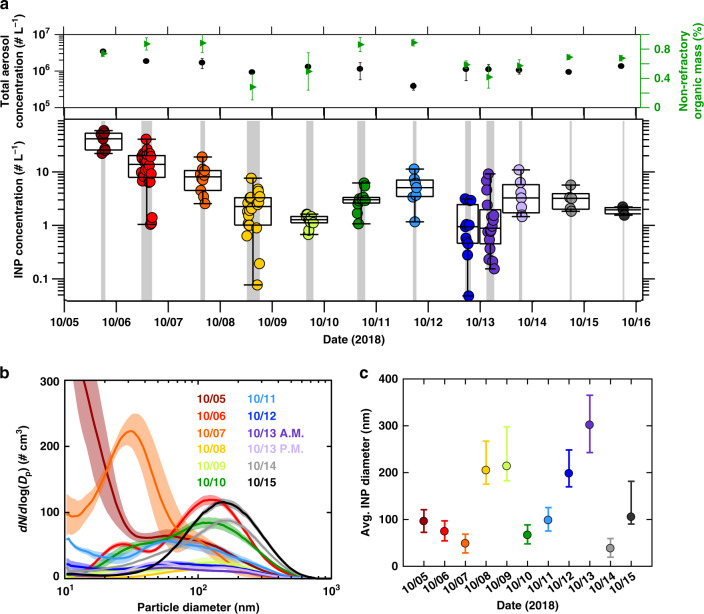
Fig. 1. Ambient aerosol particle abundance.
a A time series of depositional ice nucleating particle (INP) concentration (–46 °C; Sice = 1.3) and averages of total aerosol concentration and aerosol non-refractory organic mass fraction during INP sampling. Each datapoint represents the average ambient INP concentration over 10 min of measurement. Overlain box plots indicate the median, 25th and 75th percentiles, and upper and lower bounds of INP concentrations for each day. Shaded regions correspond to periods of INP measurements. b Average ambient submicron aerosol size distributions during INP measurements each day. Shading indicates a standard deviation of concentration variability. c Daily average depositional INP derived diameters. The illustrated range is a standard deviation of uncertainty derived from variability in the size dependence of the aerosol concentrator enrichment factor66.

