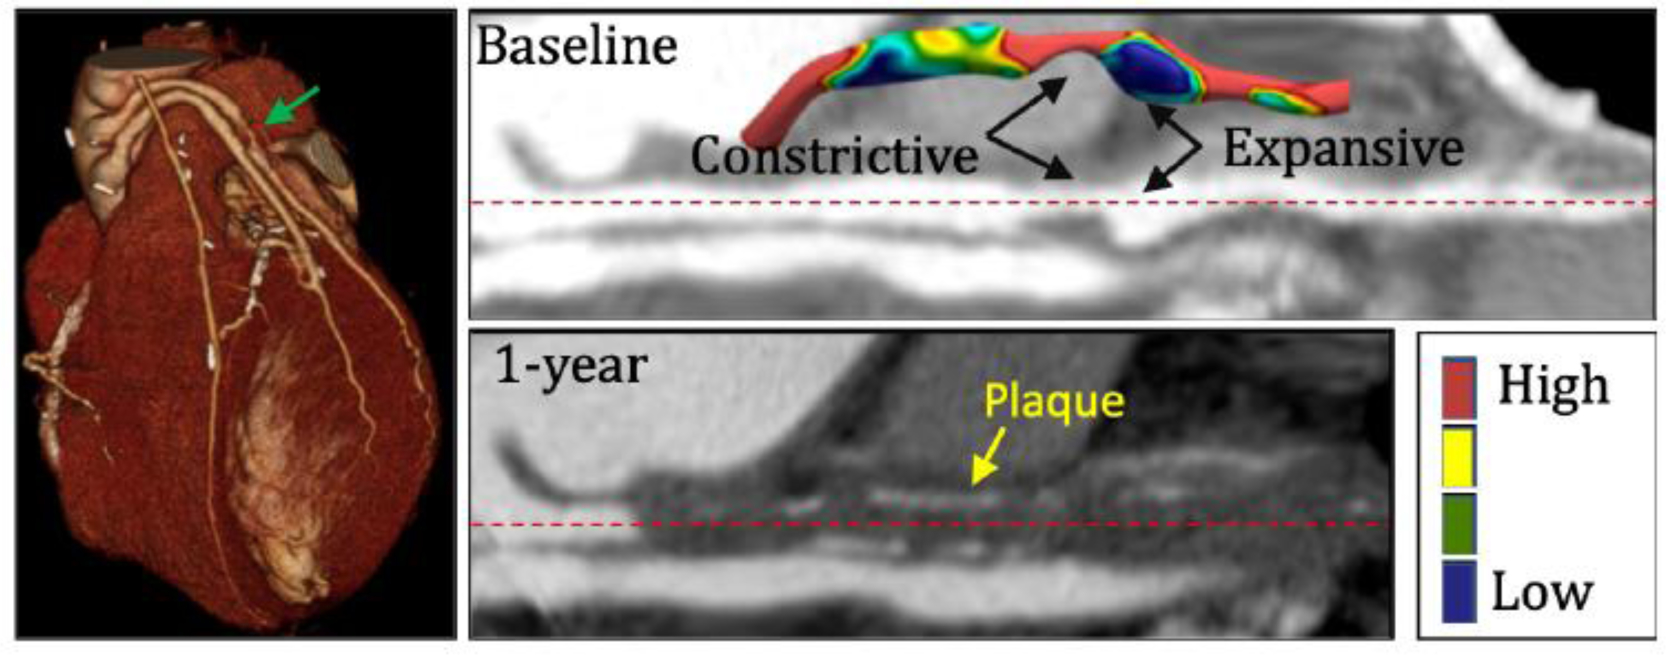
Fig 6:

Shear stress profile in region immediately distal to a severe stenosis. The left panel shows a 3D CTA visualization of a patient with stenosed SVG that was completely occluded at 1-year follow up. The green arrow identifies the stenosis. The right top and bottom panels show registered straightened image of the stenosed vessel at baseline and at 1-year follow, respectively. Inset in the top panel shows shear stress map of the stenosed SVG that highlights regions of very low WSS immediately downstream of the stenosis and an expansive remodeling phenomenon. Calcified plaque is visualized in the occluded SVG at 1-year follow-up and is marked with yellow arrow.
