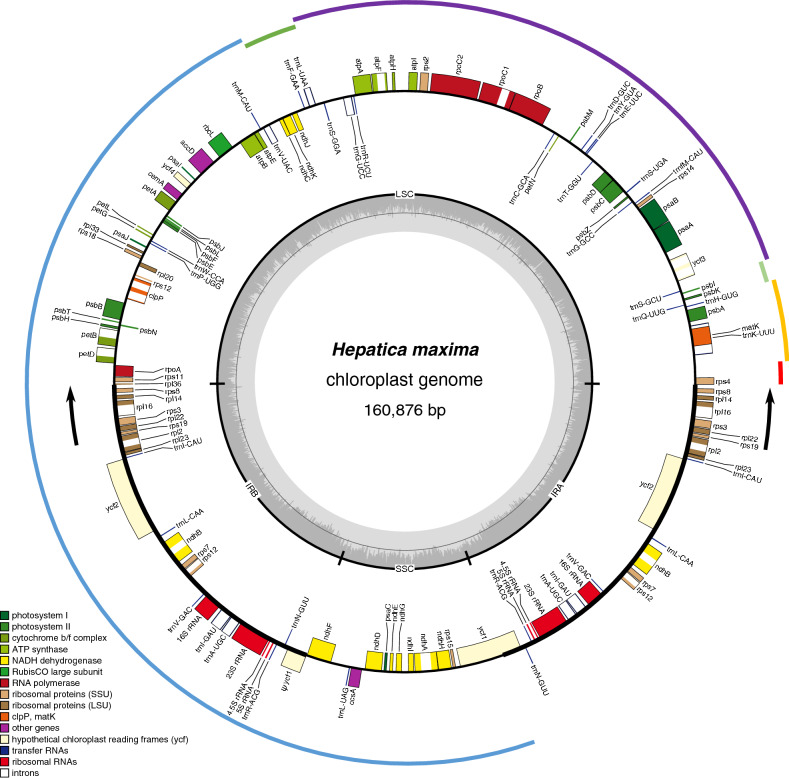
Figure 1.
Map of the plastid genome of Hepatica maxima. Genes on the inside and outside of each map are transcribed in the clockwise and counterclockwise directions, respectively. The thick lines on the plastid map indicate the inverted repeats (IRa and IRb) that separate the genome into large and small single-copy regions. Ψ denotes a pseudogene. Black arrows indicate expansion events. Colored arcs on the outside of the map correspond to the locally collinear blocks inferred by Mauve (see Supplementary Fig. S3). The figures were constructed in OGDRAW v1.3.1 (https://chlorobox.mpimp-golm.mpg.de/OGDraw.html) and InkScape v0.92.2 (https://inkscape.org).

