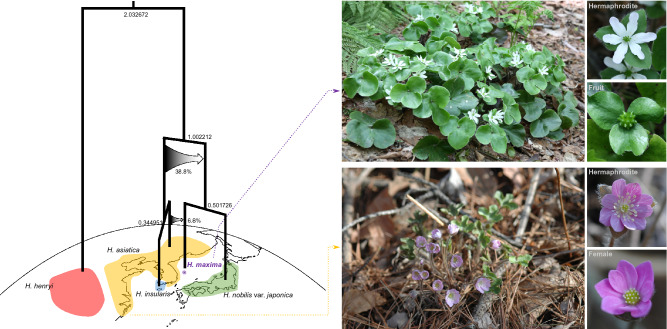
Figure 7.
Summary of two introgression events associated with the origin of H. maxima on chronogram. Numbers at nodes indicated divergence time estimate in Mya. See supplementary Fig. S5 for more detail for tribe Anemoneae. Arrows indicate introgressions with the inferred inheritance probability. Color areas indicate the geographic distribution of each species. The images were constructed in InkScape v0.92.2 (https://inkscape.org) based on the chronogram. The top right corner of the photos shows habit, flower, and fruits (mature green) of H. maxima, and the bottom right corner of the photos shows the habit and hermaphroditic and female flowers of H. asiatica.

