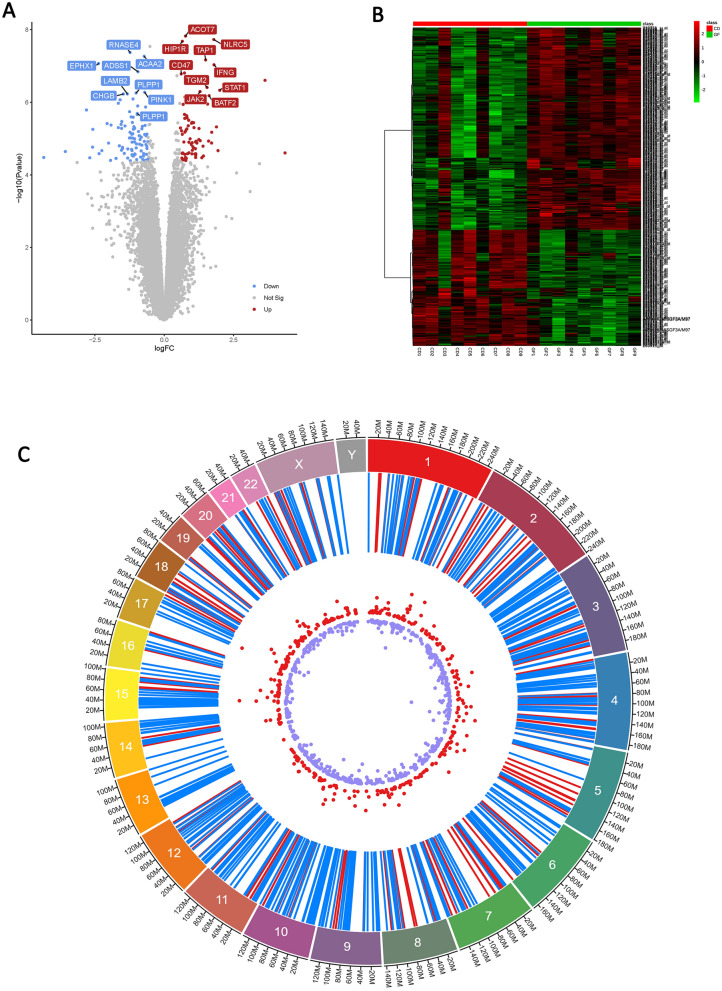
Figure 1.
The differentially expressed genes (DEGs) analysis of duodenum tissue at the time of CeD diagnosis in comparison to gluten restricted dietary managament. (A) Volcano plots of Log fold change of gene expression. (B) Heatmap of the DEGs with a LogFC > 1.5. Red: up-regulation; green: down-regulation. (C) Circos view of localization of DEGs on chromosomes (first track-chromosome number, second track- DEGs, Third track Up (Red) and Down (Blue) genes) (Circos figure generated using: https://marianattestad.com/chordial).

