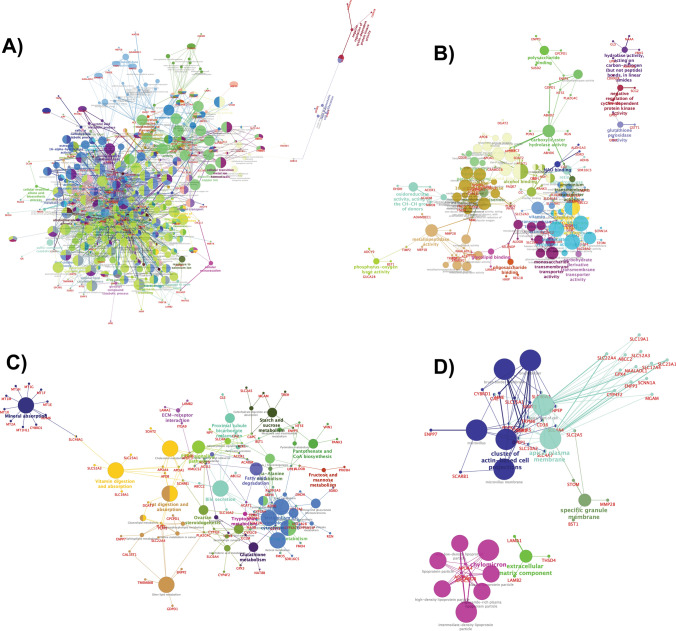
Figure 4.
ClueGO analysis of the predicted Go Annotations. Functionally grouped network of enriched categories was generated for the target genes. GO terms are represented as nodes, and the node size represents the term enrichment significance. (A) Representative Biological Process (B) Molecular Function (C) KEGG Pathways (D) Cellular components interactions among predicted targets. (A–D Figures generated using https://cytoscape.org/).

