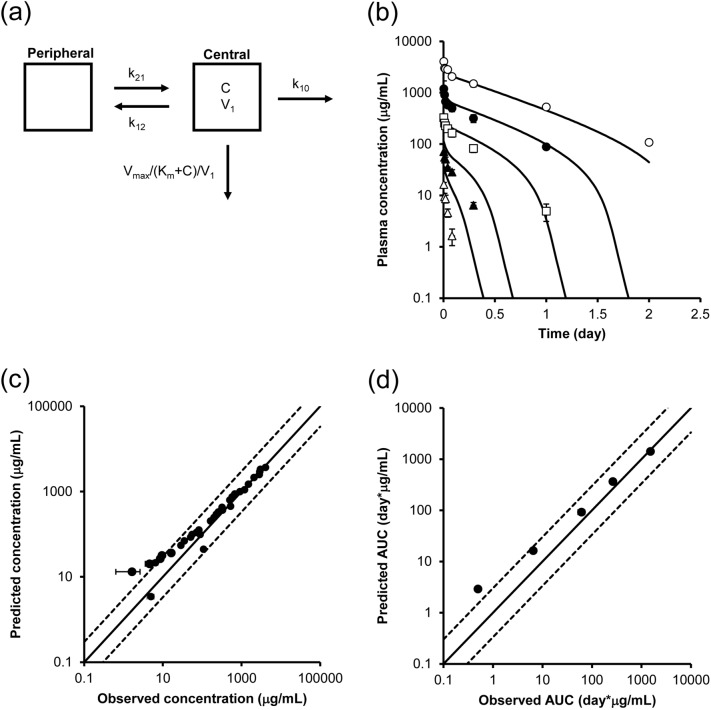
Figure 4.
PK prediction using kinetic parameters obtained from in vivo and in vitro cell-based assays. (a) PK model for simulating concentration–time profiles of the antibody. A 2-compartment model with the Michaelis–Menten equation was used for PK prediction. The in vitro Vmax was scaled by the number of target-expressing cells per whole liver, and the velocity per body weight was then calculated using the body weight of the mice. C: concentrations of the antibody. (b) Predicted and observed concentration–time profile of the antibody in mice at doses of 1 mg/kg (white triangle), 3 mg/kg (black triangle), 10 mg/kg (white square), 30 mg/kg (black circle), and 100 mg/kg (white circle). The solid line shows the simulated PK profile using in vitro parameters, and the dots show the observed concentrations. Each point represents the mean ± SD (n = 3). (c) The relationship between predicted and observed concentrations. (d) The relationship between predicted and observed AUC0–inf. The solid lines show the lines of unity, and the area between the dotted lines represents an area within a threefold difference.

