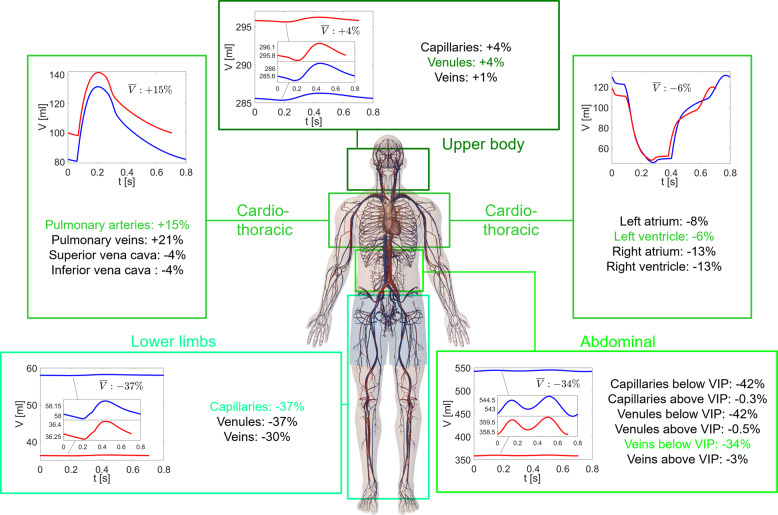
Fig. 2. Volumes throughout the body in 1G supine and 0G conditions.
Time-series of the volume, V(t), at different 0D sites: venules (upper body), left ventricle and pulmonary artery (cardio-thoracic region), veins below VIP (abdominal region), capillaries (lower limbs). Blue: supine 1G configuration on the Earth; red: 0G spaceflight configuration. Mean volume () relative variations between 1G and 0G configurations are reported for each region (colored values refer to the corresponding time-series shown).

