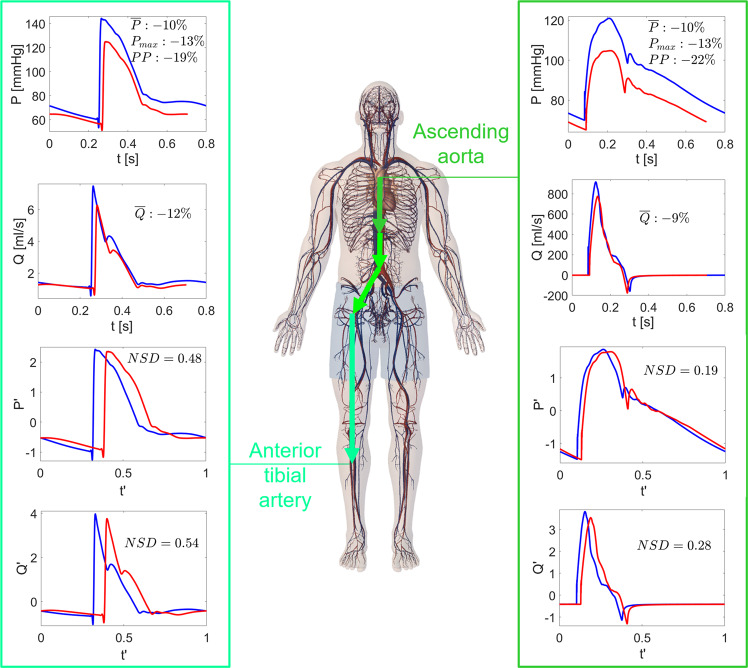
Fig. 4. Proximal-to-distal arterial tree: pressures and flow rates in 1G supine and 0G conditions.
Time-series P(t), Q(t), , and at the extremes of the 1D arterial proximal-to-distal tree: ascending aorta and anterior tibial artery. Blue: supine 1G configuration on the Earth; red: 0G spaceflight configuration. NSD values for and , together with mean pressure (), mean flow rate (), max pressure (), and pulse pressure (PP) relative variations between 1G and 0G configurations are reported in the panels.

