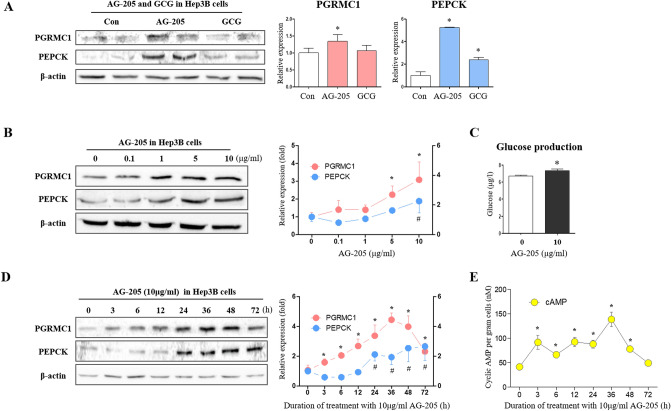
Figure 1.
Induction of PEPCK, cyclic AMP and gluconeogenesis by AG-205. (A) Western blot analysis and quantification of PGRMC1 and PEPCK in Control, Glucagon (GCG), and AG-205 group. GCG (100 µM, 2 h) and AG-205 (10 µg/ml, 18 h) were treated in DMEM-low glucose medium (50 mg/dl, w/o FBS, 1% Penicillin/Streptomycin, 1 nM dexamethasone). Values represent means ± SD. *p < 0.05 versus Control. (B) Western blot analysis and quantification of PGRMC1 and PEPCK in control versus AG-205 group. AG-205 (0.1, 1, 5, and 10 µg/ml) was treated in DMEM-low glucose medium (50 mg/dl, w/o FBS, 1% Penicillin/Streptomycin, 1 nM dexamethasone) for 18 h. β-actin was used as an internal control. Values represent means ± SD. *p < 0.05 versus control. (C) Glucose production was measured by glucose peroxidase assay. After AG-205 pre-treatment (10 µg/ml) for 48 h, cells were incubated with glucose production buffer (sodium pyruvate 2 mM, dexamethasone 1 nM, w/o glucose) for 2 h. Values represent means ± SD. *p < 0.05 versus control. (D) Western blot analysis and quantification of PGRMC1 and PEPCK in 0 h versus 3, 6, 12, 24, 36, 48, and 72 h. AG-205 (10 µg/ml) was treated in DMEM-low glucose medium (50 mg/dl, w/o FBS, 1% Penicillin/Streptomycin, 1 nM dexamethasone) for indicated hours. β-actin was used as an internal control. Values represent means ± SD. *p < 0.05 vesus 0 h. (E) Cyclic AMP (cAMP) levels of indicated hours. AG-205 (10 µg/ml) was treated in DMEM-low glucose medium. Data were normalized to loading cell number, 5000 cells per well. Values represent means ± SD. *p < 0.05 versus 0 h. All experiments were repeated at least 3 times.

