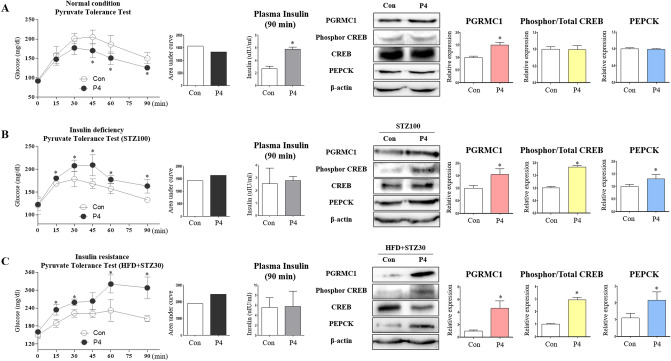
Figure 6.
Progesterone induces gluconeogenesis in state which insulin has almost no interference. (A) Pyruvate tolerance test was performed after 24 h of fasting. Sodium pyruvate (2 g/kg) was dissolved in PBS and injected into intraperitoneal cavity. AUC was measured. Insulin level was measured after 24 h of fasting and following PTT. Western blot analysis and quantification of PGRMC1, phosphorylated/total CREB, and PEPCK in livers of Control versus P4 group. β-actin was used as an internal control. Values represent means ± SD. *p < 0.05 versus Control. (B) Mice were administered high-dose of streptozotocin (100 mg/kg). Pyruvate tolerance test was performed after 24 h of fasting. AUC was measured. Insulin level was measured after 24 h of fasting and following PTT. Western blot analysis and quantification of PGRMC1, phosphorylated/total CREB, and PEPCK in livers of STZ100 versus P4 + STZ100 group. β-actin was used as an internal control. Values represent means ± SD. *p < 0.05 versus Control. (C) Mice were administered high-fat diet and low-dose of streptozotocin (30 mg/kg). Pyruvate tolerance test was performed after 24 h of fasting. AUC was measured. Insulin level was measured after 24 h of fasting and following PTT. Western blot analysis and quantification of PGRMC1, phosphorylated/total CREB, and PEPCK in livers of HFD + STZ30 versus P4 + HFD + STZ30 group. β-actin was used as an internal control. Values represent means ± SD. *p < 0.05 versus Control.

