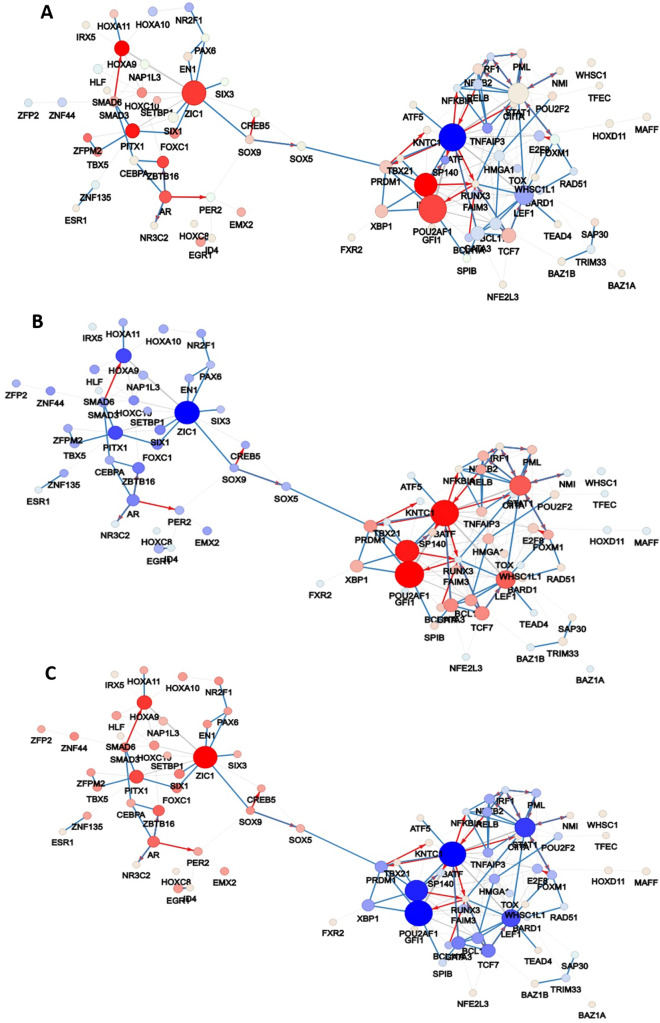
Figure 2.
(A) The enriched network of the 126 TFs visualised in CoRegNet. The network was inferred using the DEG list of samples of synovial tissue between OA and RA patients. (B) Co-regulatory network showing the TF influence on the RA samples and (C) OA samples. The sphere size is proportional to the number of target genes of the TF/co-TF pairs. Lines between spheres represent the interaction between TFs/co-TFs pairs. The red colour indicates a strong TF influence and the blue colour indicates a weak TF influence.

