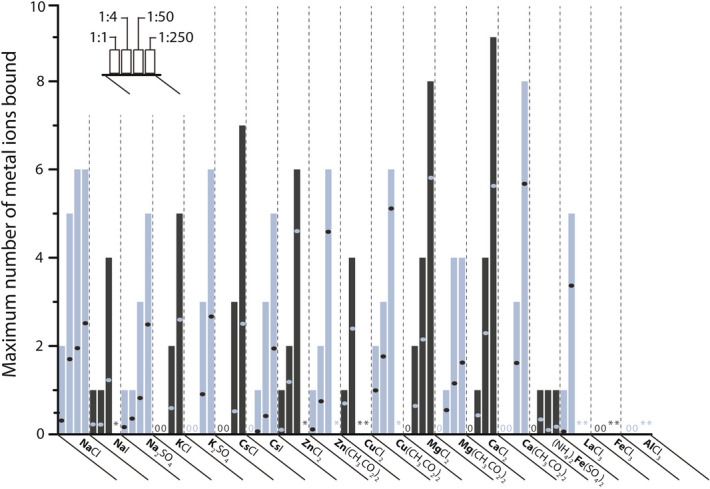
Figure 2.

Maximum and average number of binding of various metal ions (in bold) to the 8+ charge state of α-syn. Per metal salt four bars are shown which correspond to protein:metal ion ratios of 1:1, 1:4, 1:50 and 1:250 from left to right. The height of each bar indicates the maximum number of metal ions bound (S/N ≥ 3), and the dot in each bar corresponds to the average metal binding (weighted peak intensities of all stoichiometries detected, including the unbound state when present). In cases where it was difficult to determine the stoichiometry due to poorly resolved signal, an asterisk* is shown. When no binding of metal ions was observed, ‘0′ is shown.
