Figure 8.
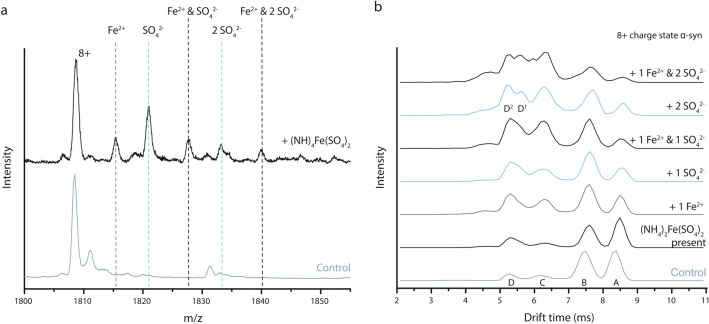
(a) Mass spectrum of the 8+ charge state of α syn without ions bound, in absence (control) and presence of 5 mM (NH4)2Fe(SO4)2. Binding of Fe2+ is indicated in grey while SO42− binding is indicated in blue. Black dashed lines indicate a peak with one or two SO42− bound and one Fe2+ bound. (b) Comparison of drift time plots of the 8+ charge state of α syn in the absence (Control) and presence of 5 mM (NH4)2Fe(SO4)2 resulting in various bound states. Different conformations are labelled “A” (most extended) to “D” or “D1/D2” respectively (most compact).

