
Figure 5.
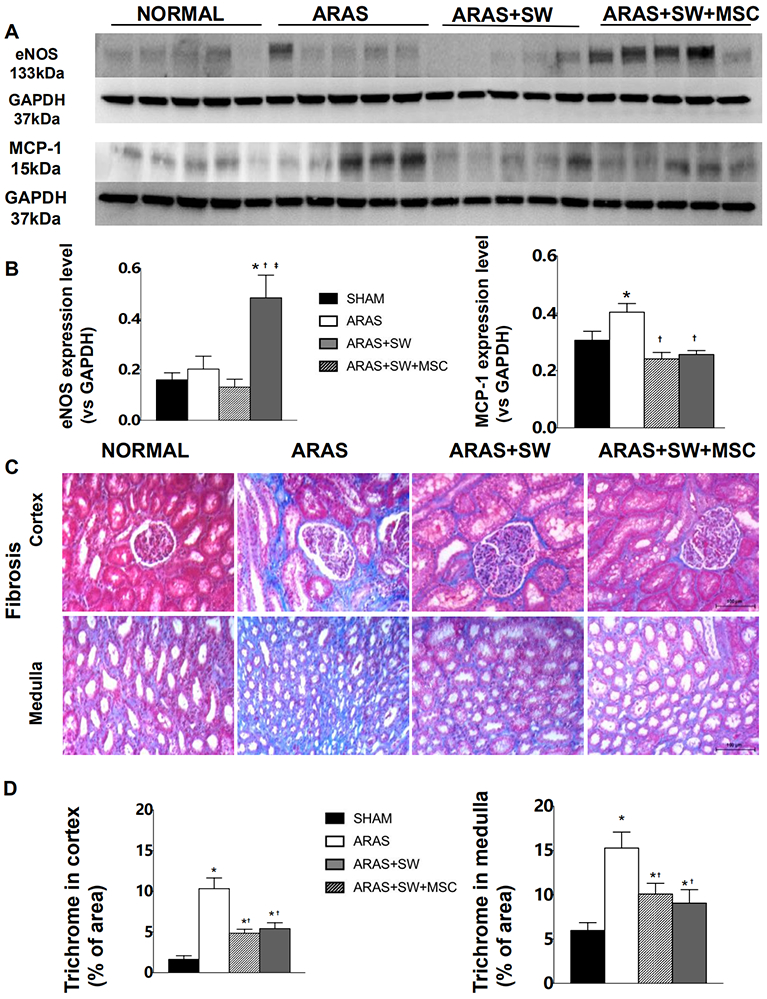
A: Renal expression of endothelial nitric oxide synthase (eNOS) and monocyte chemoattractant protein (MCP)-1. B: Expression of eNOS increased in ARAS+SW+MSC compared to all other groups; MCP-1 expression increased in ARAS and was normalized by all treatments. C: Representative trichrome-stained cortex and medulla (x20). D: ARAS increased trichrome staining compared to Normal, which was alleviated both by SW and SW+MSC. *p<0.05 vs. Normal, †p<0.05 vs. ARAS, ‡p<0.05 vs. ARAS+SW(n=5-6/group). Results are mean±SEM.