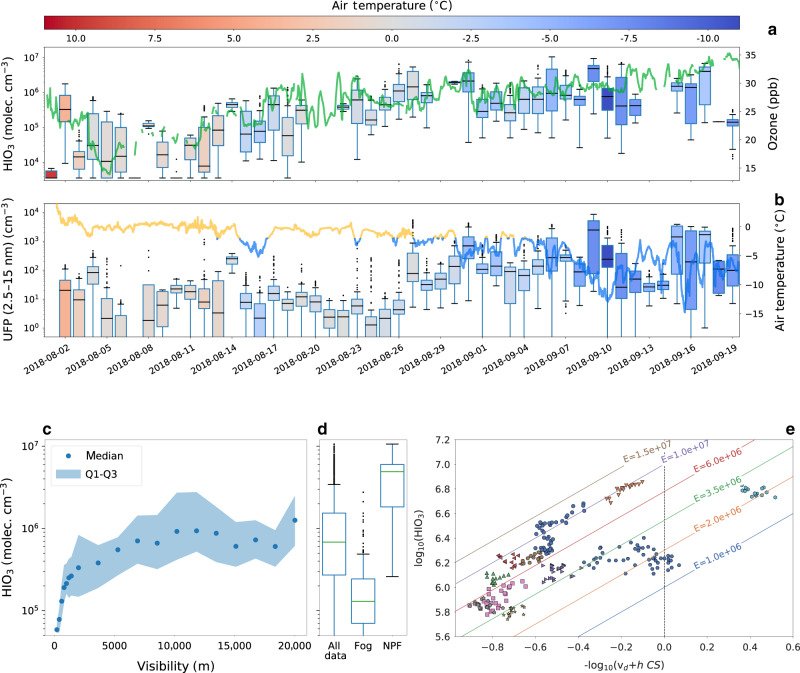
Fig. 2. Factors controlling iodic acid concentration and NPF over the pack ice in the central Arctic Ocean.
a Daily box and whiskers plot of iodic acid, where the box extends from the first quartile (Q1) to the third quartile (Q3) with a line indicating the median. The whiskers are set to 1.5*[Q3–Q1]. The boxes are color-coded with the daily mean air temperature measured from the upper deck of the ship (roughly 25 m above sea level). The continuous green line shows the ozone concentration (axis on the right). b Daily box and whiskers plot of the ultrafine particle concentration (UFP), particles with a diameter between 2.5 and 15 nm. The continuous line shows the near-surface air temperature, with values lower than −2 °C colored in blue and above in yellow (axis on the right). c Iodic acid concentration during autumn as a function of visibility, dots indicate the median and the shaded area the interquartile range [Q3–Q1]. d Iodic acid concentration box and whiskers plot for different conditions during the autumn period. In particular, we report values for the entire autumn period, during fog (visibility below 2 km) and during NPF events. e Iodic acid data as a function of dry deposition velocity (vd), boundary layer height (h) and condensation sink (CS). Iodic acid data correspond only to clear conditions (visibility > 4 km) and periods when steady-state conditions could be assumed. Eleven steady-state periods are given by differently colored symbols. The colored lines represent different emission rates (E) based on our model.

