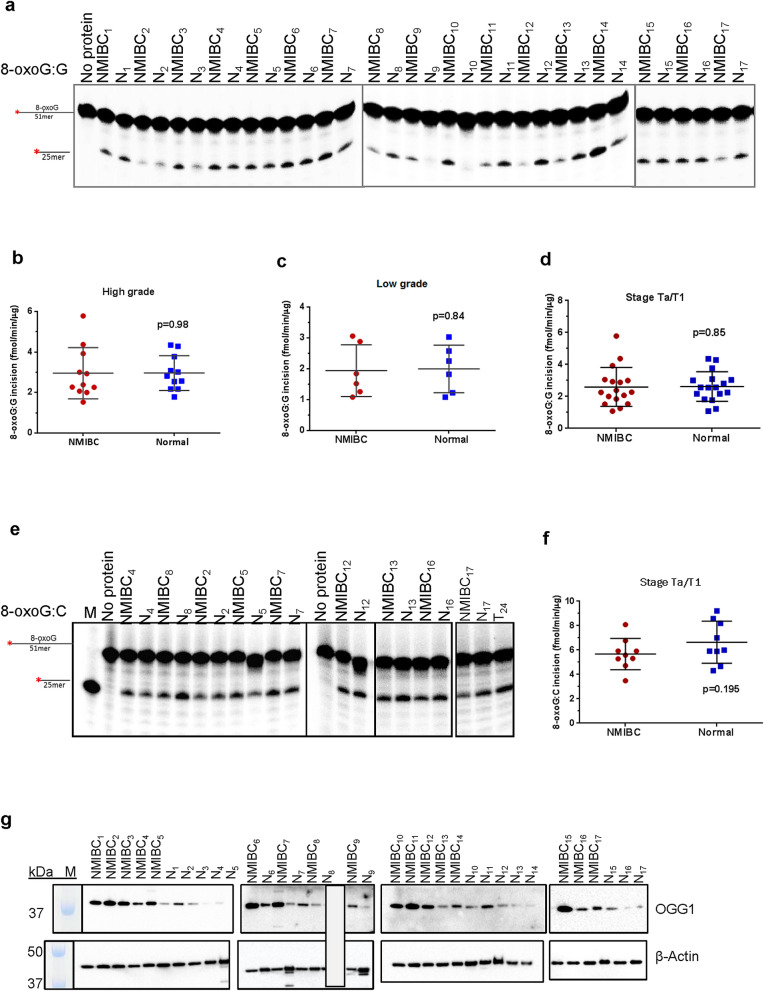
Figure 3.
8-oxoG incision activity and OGG1 protein levels in NMIBC and their corresponding normal tissues. (a) Representative gel for 8-oxoG incision. Incision products are 25mer derived from cleaved 32P-labeled 51mer DNA substrate containing uracil 8-oxoG at position 26. N, the corresponding normal tissue. Quantitation of 8-oxoG incision from high-grade (b), low-grade (c) and Ta/T1 stages (d) of all NMIBC and their corresponding normal tissues (fmol/μg/min). (e) Representative gel for 8-oxoG:C incision. (f) Quantitation of 8-oxoG:C incision. (g) Western blot analysis of OGG1 and β-actin in NMIBC and their corresponding normal tissues. Low-grade sample numbers are 2, 4, 9–12; high-grade sample numbers are1, 3, 5–8, 13–17. The full-length gels/blots are presented in Supplementary Fig. 3. Radioactive gels were visualized by Typhoon FLA 9500 PhosphorImager and analyzed using the ImageQuant software TL v8.1 (https://www.cytivalifesciences.com/en/us/shop/protein-analysis/molecular-imaging-for-proteins/imaging-software/imagequant-tl-8-1-p-00110).

