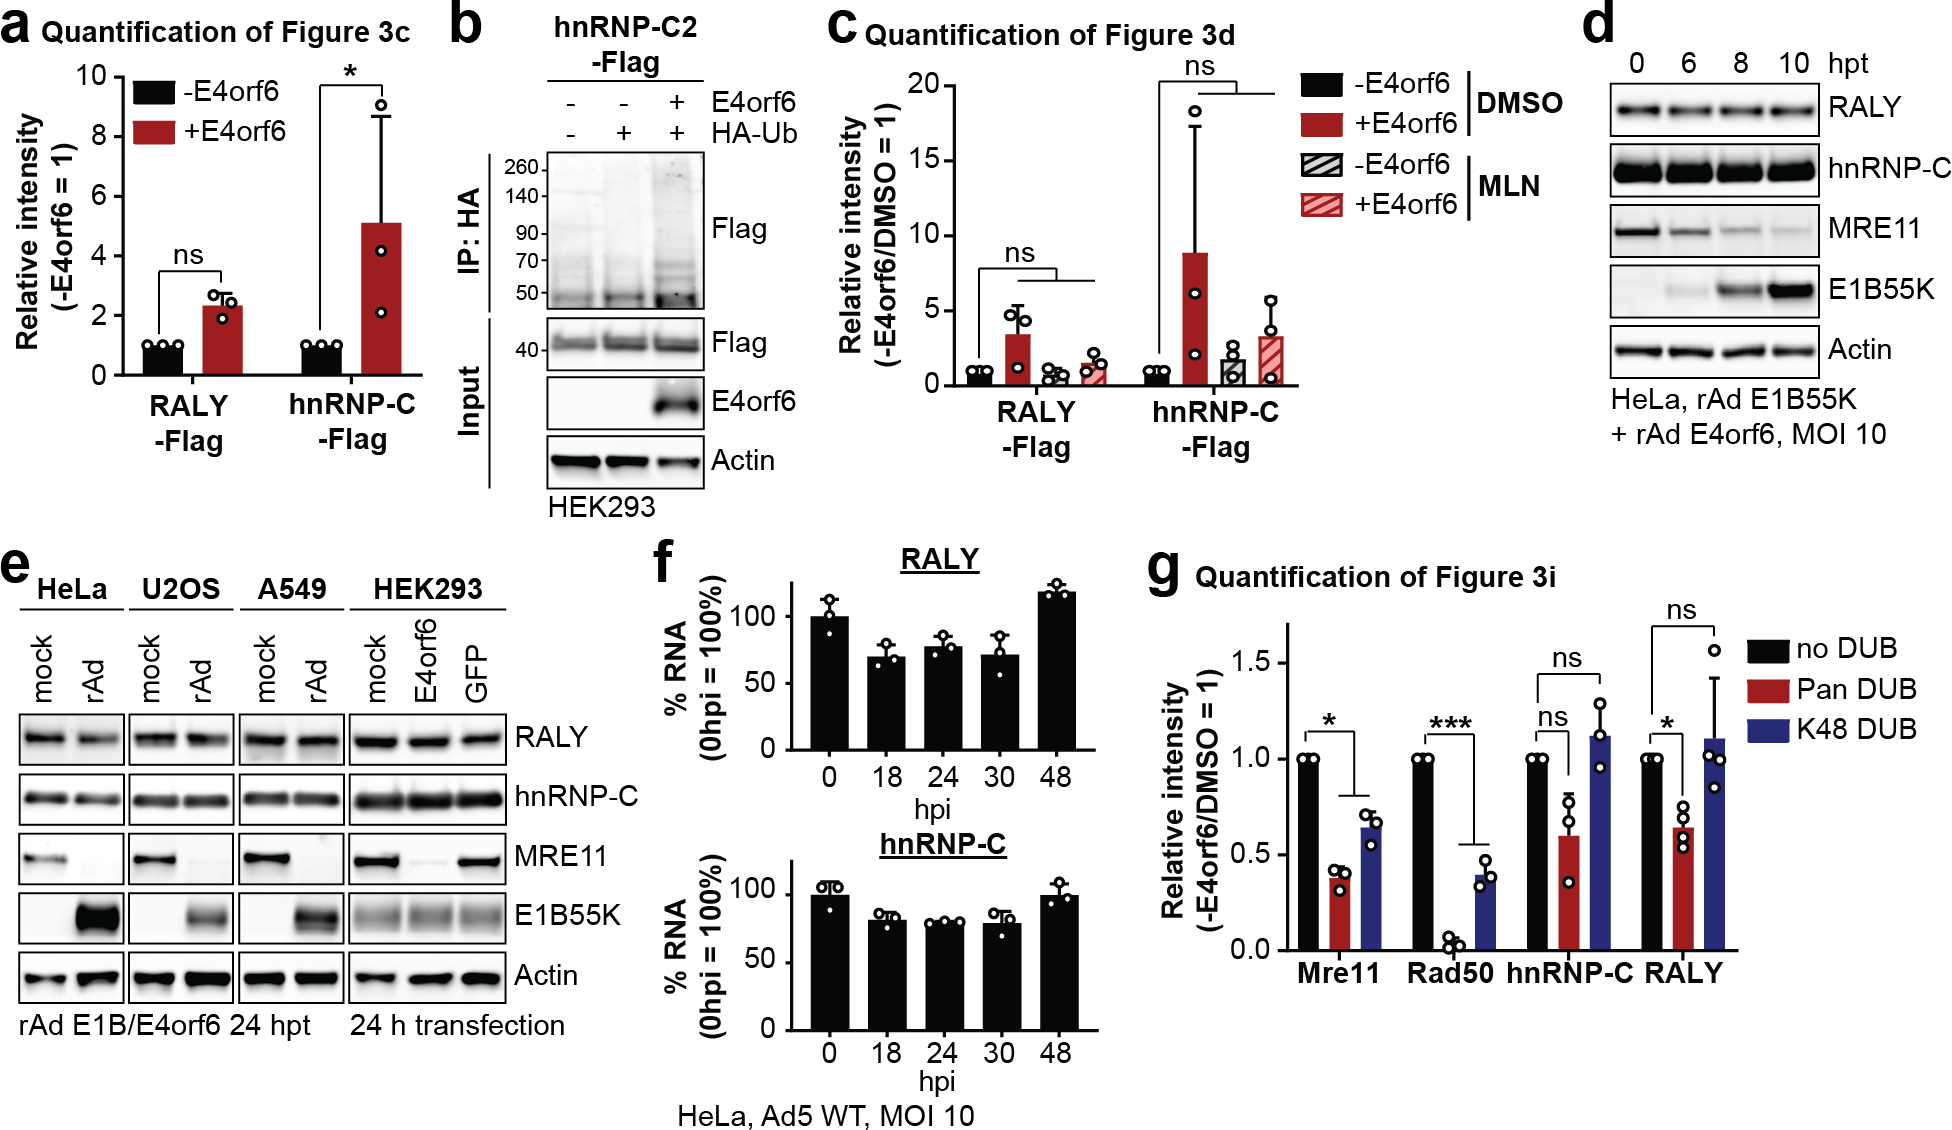
Extended Data Fig. 6. RALY and hnRNP-C are not decreased upon transduction in multiple cell lines.

a, Quantification of results shown in Figure 3c. b, HEK293 cells transfected with the indicated constructs for 24 h, followed by denaturing IP with HA antibody, and immunoblot analysis of hnRNP-C2-Flag. c, Quantification of results shown in Figure 3d. d, Immunoblot analysis of protein levels in HeLa cells over a time course of transduction with recombinant Ad vectors expressing only E1B55K and E4orf6 (MOI=10). e, Immunoblot analysis of protein levels in HeLa, U2OS, A549 and HEK293 cells. HeLa, U2OS and A459 cells were transduced with recombinant Ad vectors expressing only E1B55K and E4orf6 for 24 h. HEK293 cells, which contain an endogenous copy of E1B55K, were mock transfected or transfected with plasmids expressing E4orf6 or GFP. f, Bar graphs of RALY and hnRNP-C RNA levels over a time course of infection with Ad5 WT (MOI=10) relative to mock as determined by RT-qPCR. g, Quantification of results shown in Figure 3i. All data are representative of three (four for RALY in g) biologically independent experiments. All graphs show mean+SD. Statistical significance was calculated using a paired, two-tailed Student’s t-test, * p <0.05, ** p <0.01, *** p <0.005.
