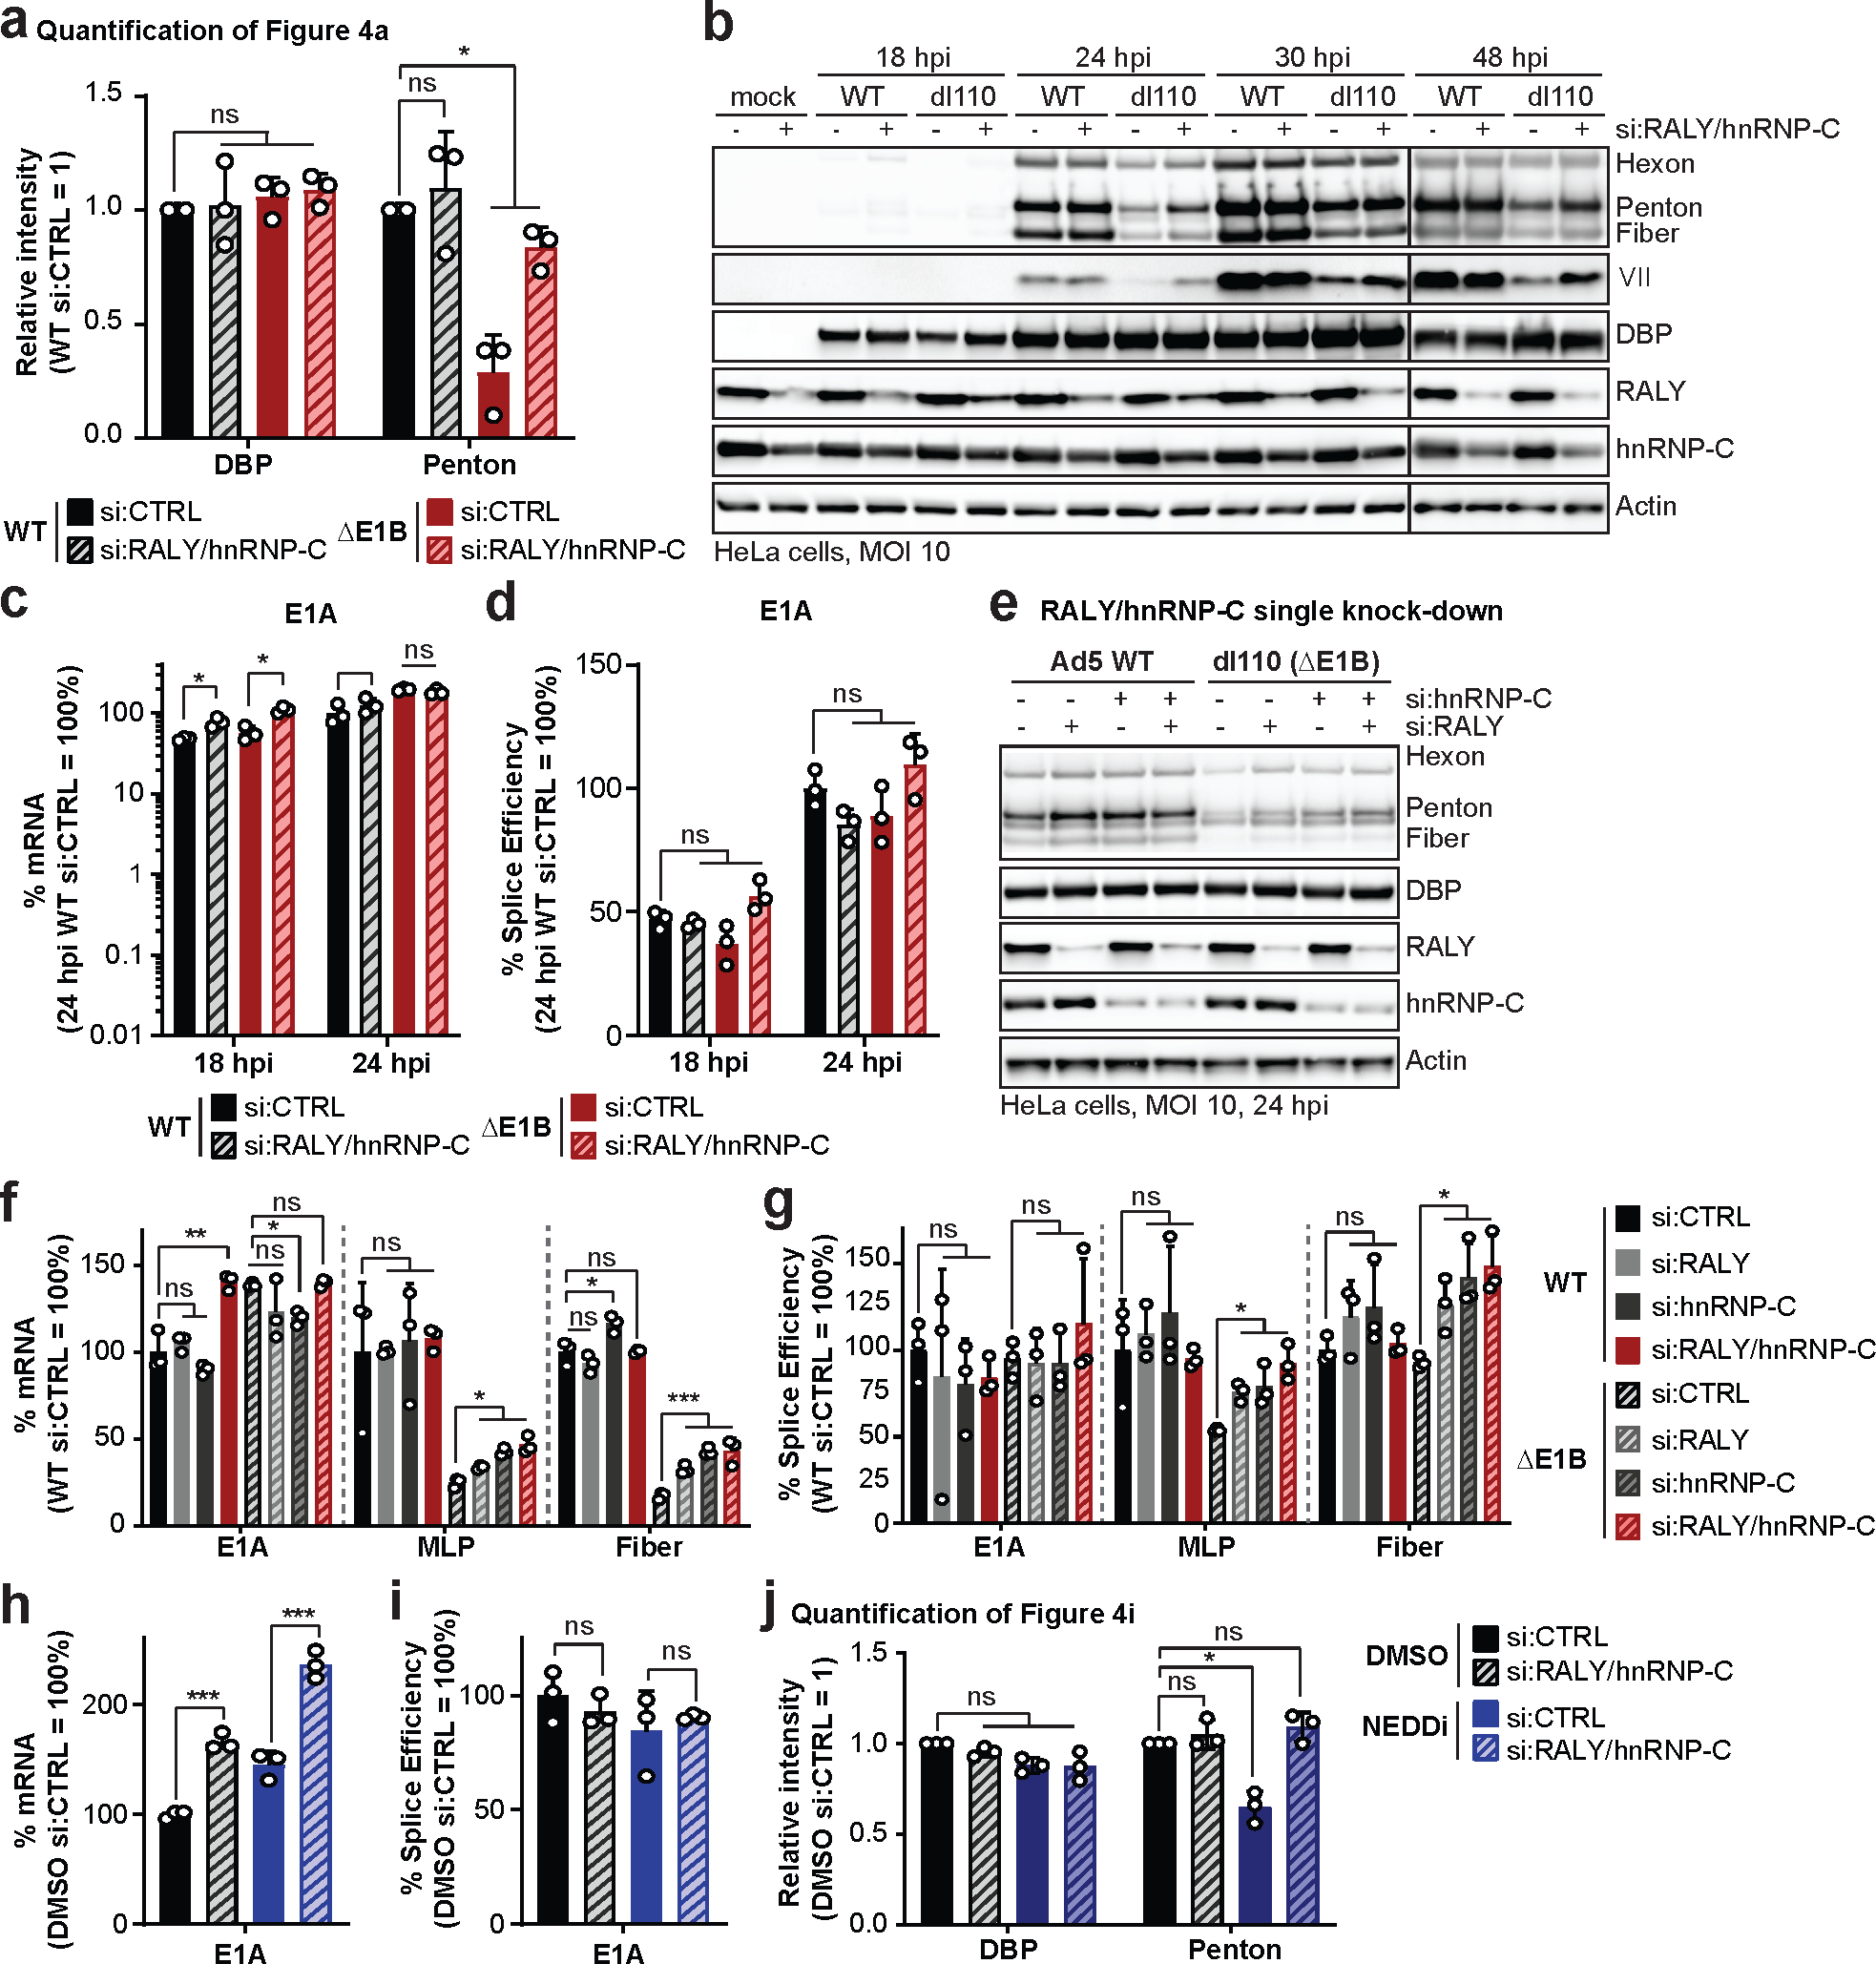
Extended Data Fig. 7. RALY and hnRNP-C single knockdowns rescue late protein, RNA and splice efficiency during infection with Ad ΔE1B.

a-d, HeLa cells transfected with control (siCTRL) or RALY and hnRNP-C (siRALY/hnRNP-C) siRNA 24 h prior to infection with Ad5 WT or ΔE1B (MOI=10), harvested at respective time points. a, Quantification of results shown in Figure 4a. b, Extended immunoblot analysis of viral and cellular protein levels. c, Bar graph representing spliced RNA levels of viral early transcript E1A measured by RT-qPCR. d, Bar graph representing splicing efficiency (ratio of spliced to unspliced transcripts) of E1A measured by RT-qPCR. e-g, HeLa cells transfected with control siRNA (siCTRL), siRNA for RALY (siRALY), siRNA for hnRNP-C (sihnRNP-C) or siRNA for both RALY and hnRNP-C (siRALY/hnRNP-C) 24 h prior to infection with Ad5 WT or ΔE1B (MOI=10) and harvested at 24 hpi. e, Immunoblot analysis of viral and cellular protein levels. f, Bar graph representing spliced RNA levels of E1A, MLP and fiber measured by RT-qPCR. g, Bar graph representing splicing efficiency of E1A, MLP and fiber measured by RT-qPCR. h-j. HeLa cells transfected with control (siCTRL) or RALY and hnRNP-C (siRALY/hnRNP-C) siRNA 24 h prior to infection with Ad5 WT (MOI=10), treated with either DMSO or NEDDi at 8 hpi and processed at 24 hpi. h, Bar graph representing spliced RNA levels of E1A measured by RT-qPCR. i, Bar graph representing splicing efficiency as defined as the ratio of spliced to unspliced transcripts of E1A measured by RT-qPCR. j, Quantification of results shown in Figure 4i. All data are representative of three biologically independent experiments. All graphs show mean+SD. Statistical significance was calculated using paired (a and j) or unpaired (others), two-tailed Student’s t-test, * p <0.05, ** p <0.01, *** p <0.005.
