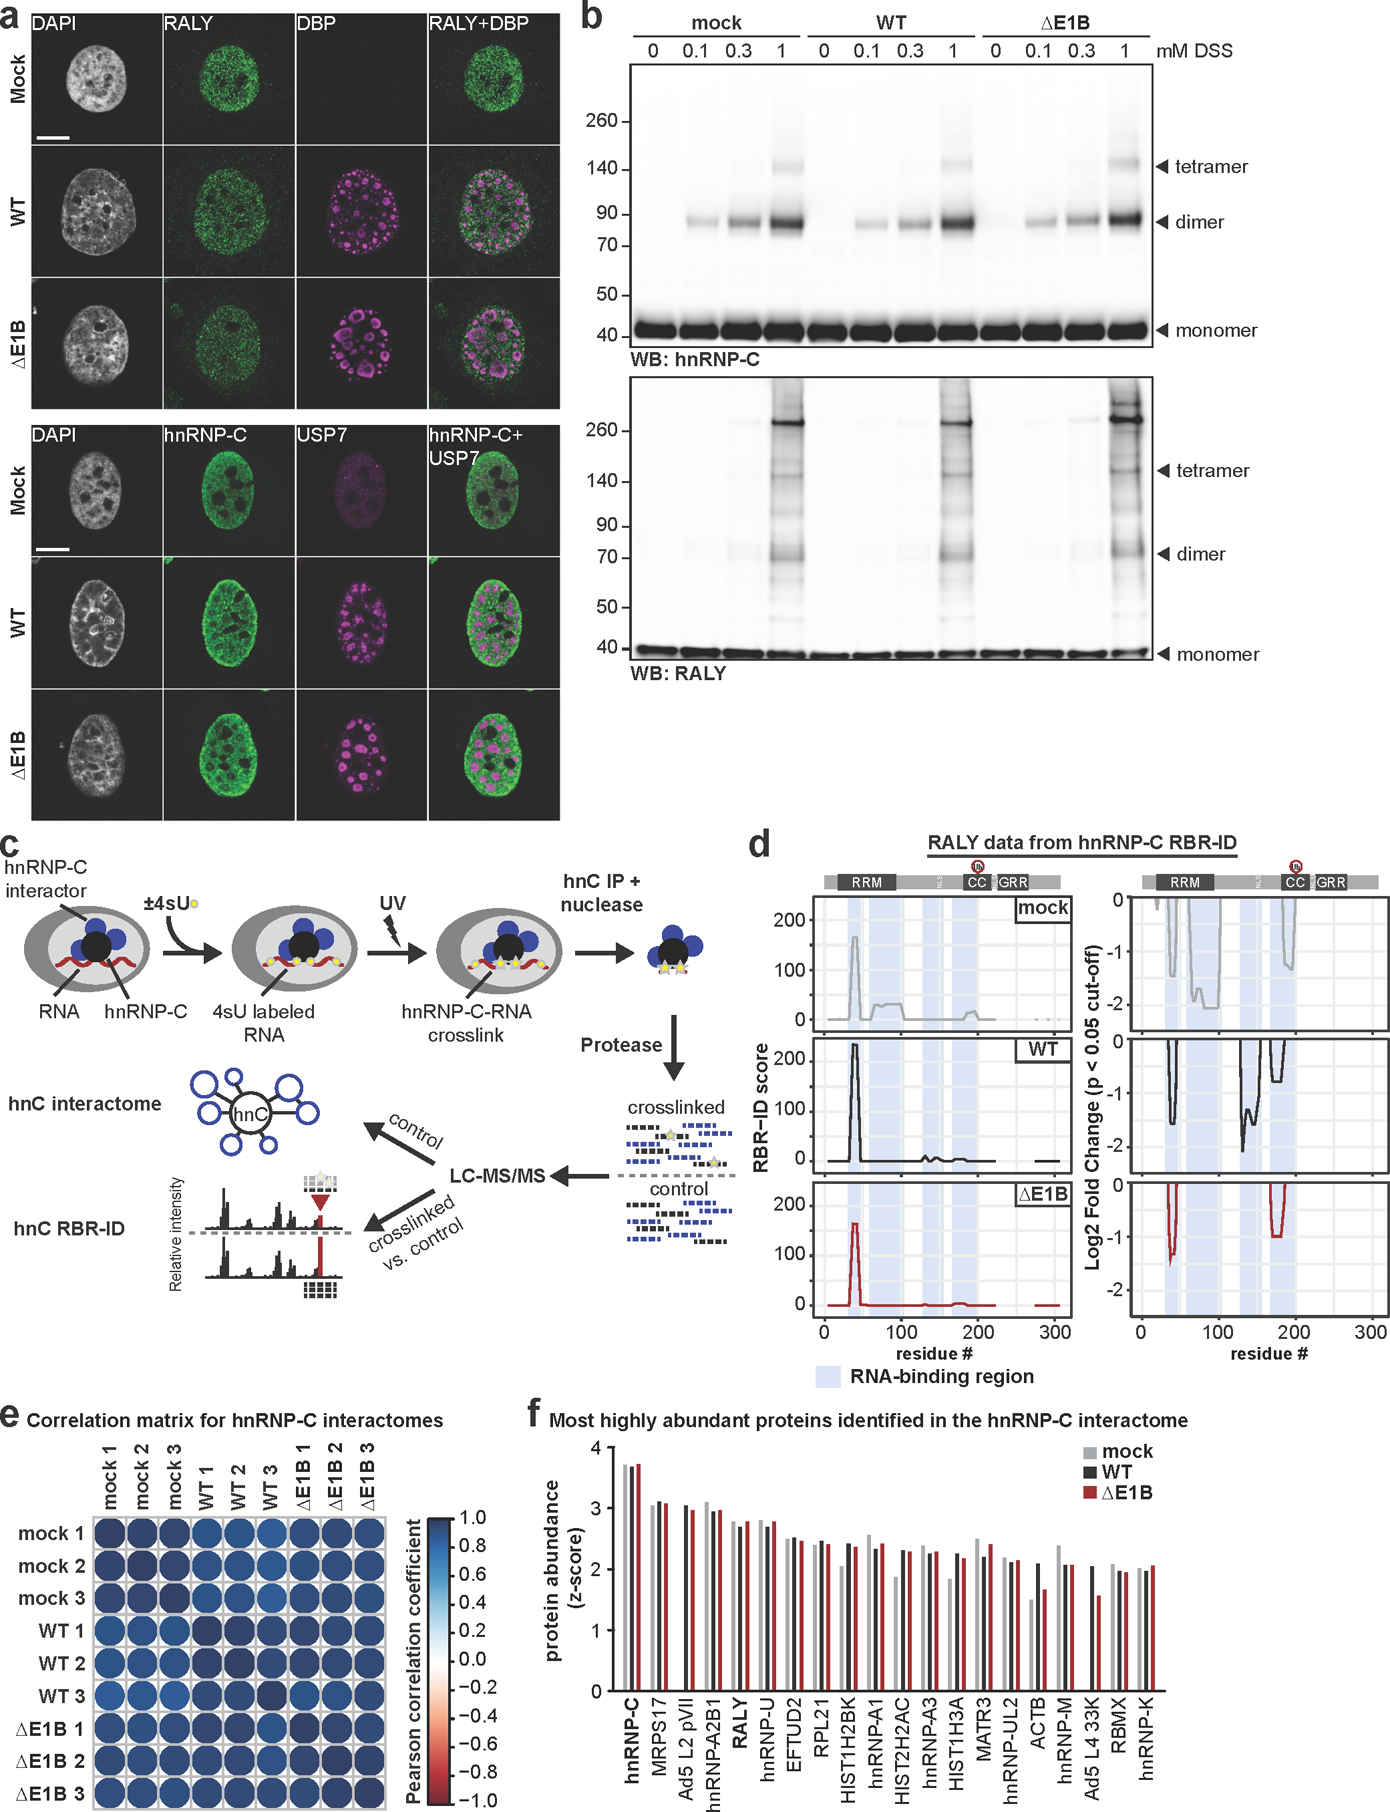
Extended Data Fig. 8. No dramatic difference in protein localization and protein-complex formation of RALY and hnRNP-C between Ad WT and ΔE1B infection.

a, Representative images of immunofluorescence comparing the localization of RALY and hnRNP-C (both green) in mock, Ad WT and ΔE1B infection of HeLa cells (MOI=10, 24 hpi). Viral replication centers are stained by DBP or USP7 (both magenta) and nuclear DNA by DAPI (grey). Scale bar=10 μm. b, Immunoblot analysis of RALY and hnRNP-C protein complexes formed upon mock, Ad WT and ΔE1B infection of HeLa cells (MOI=10) and treatment with indicated concentrations of disuccinimidyl suberate (DSS) for 30 min at 24 hpi. c, Schematic for targeted hnRNP-C RNA-binding region identification (RBR-ID) and interactome. d, Data for RALY from hnRNP-C RBR-ID experiment comparing mock (grey), Ad5 WT (black), and ΔE1B (red) at 24 hpi (MOI=10). Shown are smoothed residue-level RBR-ID score plotted along the primary sequence (left) and smoothed residue-level fold-change between crosslinked and control conditions with a significance threshold of p <0.05 (right). RALY domain structure with ubiquitination site is shown above graphs. RNA-binding regions are highlighted in blue. e, Correlation matrix for hnRNP-C interactome between replicates of mock, Ad5 WT, and Ad5 ΔE1B. Color gradient is based on the Pearson correlation coefficient. f, Comparison of z-scores for top 20 proteins identified in hnRNP-C interactome during WT Ad5 infection (MOI=10, 24 hpi). Mock=grey, Ad5 WT=black, Ad5 ΔE1B=red. All data are representative of three biologically independent experiments.
